|
Long-term inflation on the Steem blockchain is characterized by a complex, dynamic trajectory shaped by protocol rules, token economics, and market factors. Over the past several years, the inflation rate and the daily issuance of new STEEM have been influenced by scheduled declines, token burning, SBD (Steem Backed Dollar) conversions, and significant market events.
Core Trends and Mechanisms
Scheduled Decline in Inflation:
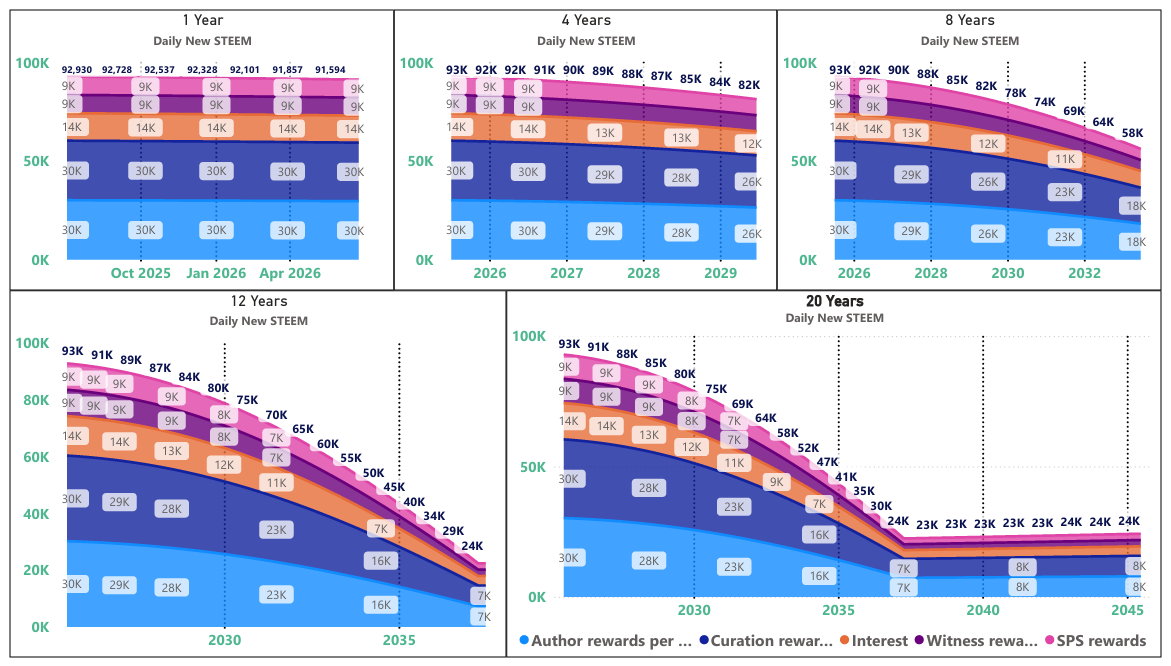
The Steem blockchain is designed so that the inflation rate—and thus the number of new STEEM created per day—declines over time. For example, projections from late 2023 showed daily STEEM production peaking near 89,900 and then steadily declining, with a projected drop of over 75% by 2037[1][2]. This decline is hardcoded unless altered by protocol changes. Impact of SBD Conversions:
A major recent development has been the dramatic effect of SBD conversions on inflation. When SBDs are converted to STEEM, especially during periods when the STEEM price is below the SBD "haircut threshold," the blockchain must issue more STEEM per SBD. This can cause actual inflation to spike well above the protocol's scheduled rate. For instance, after the Upbit exchange delisted SBD in early 2025, a surge in SBD conversions led to a local peak of over 93,000 new STEEM per day and annualized observed inflation rates as high as 22.88%—far above the theoretical rate[3][4]. Token Burning and Missed Blocks:
Burning STEEM (for post promotion, community initiatives, or other reasons) and missed blocks by witnesses both act to reduce the effective inflation rate, as these mechanisms remove tokens from circulation or prevent their creation[5][2][4]. STEEM Price Effects:
The price of STEEM relative to the SBD print threshold is a dominant factor. When STEEM trades above this threshold, inflation can actually become deflationary, as fewer new tokens are required for SBD conversions. Conversely, when STEEM is below the threshold, inflation can spike sharply[6][5][1][4].
Recent Developments and Projections (2023–2025)
| Period | Daily New STEEM | Inflation Rate (Scheduled) | Observed Inflation Rate | Notable Events/Factors |
|---|
| Q4 2023 | ~89,900 | ~6.5% | Slightly lower | Approaching theoretical peak |
| Q1 2024 | ~87,500 | ~6.4% | Deflationary episode | STEEM price above SBD threshold |
| Q2 2024 | ~89,500 | ~6.3% | Up to 16% (virtual) | STEEM price fell below SBD threshold |
| Q4 2024 | ~88,800 | ~6.1% | ~4.2% | Token burning, price effects |
| Q1 2025 | ~92,700 | ~6.0% | Up to 22.9% | Upbit SBD delisting, SBD conversion surge |
| Q2 2025 | ~92,900 | ~5.9% | ~6.2% (30-day avg) | Ongoing SBD conversions, elevated inflation |
- Long-Term Projections:
If no major protocol changes occur, daily new STEEM production is expected to decline continuously until about 2037, potentially bottoming out near 22,000 STEEM per day, with the inflation rate stabilizing around 0.95%[1][2][3].
- More than half of all STEEM that will ever exist has already been issued, with roughly 54% of the projected 30-year supply in circulation as of mid-2025[1][2].
Key Takeaways
- Inflation is not linear or predictable in the short term due to market-driven SBD conversions, token burning, and price swings.
- Major market events (like exchange delistings) can cause sharp, temporary increases in inflation by triggering mass SBD conversions[3][4].
- The most effective way to reduce inflation is to increase the price of STEEM above the SBD print threshold, which reduces the number of new STEEM needed for SBD conversions[5][1][4].
- Protocol parameters and witness decisions can alter the trajectory at any time, so all projections are subject to change[2][3][4].
In summary, while Steem's long-term inflation is scheduled to decline, real-world factors—especially SBD conversion activity and market price—can cause significant deviations from the theoretical curve, sometimes pushing inflation much higher than anticipated.[3][4]
References: [1], [2], [3], [4], [5], [6], [7], [8]
|
As far as I remember your posts, the AI has now written more of a summary. I don't see any evaluations or judgements of your conclusions now, do you?
chriddi, moecki and/or the-gorilla
@remlaps-lite, this is an absolutely fascinating application of AI to analyze your own Steem inflation reports! The way you've prompted Perplexity to summarize the complexities of Steem's tokenomics is brilliant.
It's impressive how the AI captured the nuances of scheduled inflation decline, SBD conversions, and the impact of token burning – even if it needed a little human correction. The table summarizing recent developments is incredibly insightful, and the key takeaways are spot on. This post not only provides a concise overview of Steem's inflation but also sparks a conversation about how AI can help us understand blockchain data.
Have you considered experimenting with other AI tools or different prompts to see if you can refine the analysis further? I'm curious to know if you plan to create another post to highlight areas where AI struggles with blockchain-specific concepts. Thanks for sharing this innovative approach!