Steemit Statistics - 2017.06.16

Welcome to my daily analytical report about Steemit.
All the information presented in this report are based on the data collected from the blockchain until 2017-06-16 midnight UTC time. The goal of this report is to provide you with a clear view on what is happening daily on Steemit.
1. New users
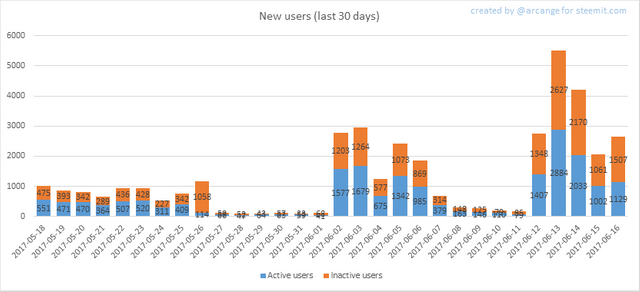
This chart shows the number of newly registered users on Steemit and how many of them became active. We see that a lot of accounts are registered, but never used.
Warning: this graphic is kind of dynamic! A user can register one day and become a few days later. Therefore, the number of active users on a specific date may change from day to day.
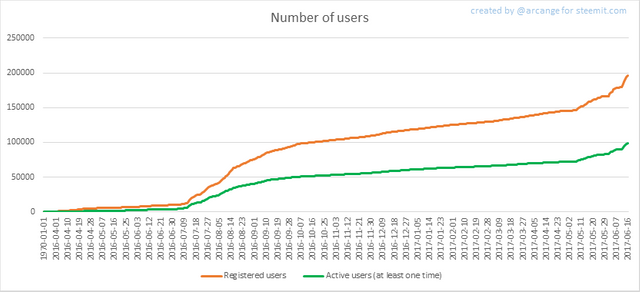
In this graph, the orange line shows the total number of registered accounts.
The green line shows how many of them have been active at least once (by active, I mean those who made at least one post, comment or upvote). They are included even if they become inactive later.
2. Post and comments
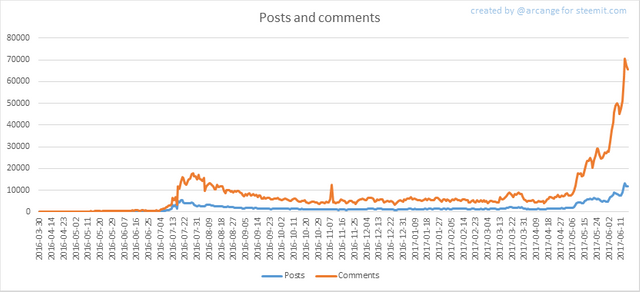
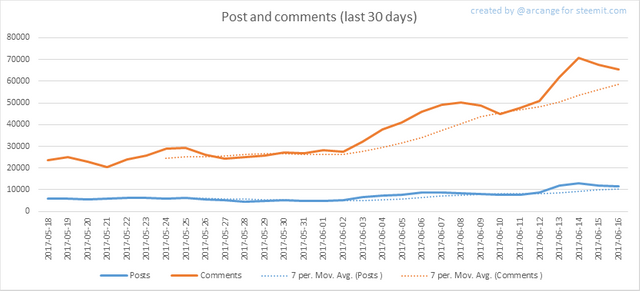
These graphs show the evolution of posts and comments for the whole blockchain lifetime and for the last 30 days.
3. Curation
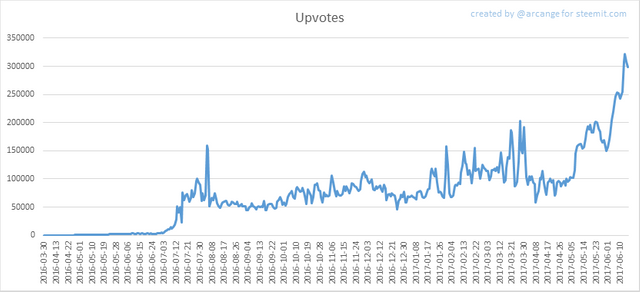
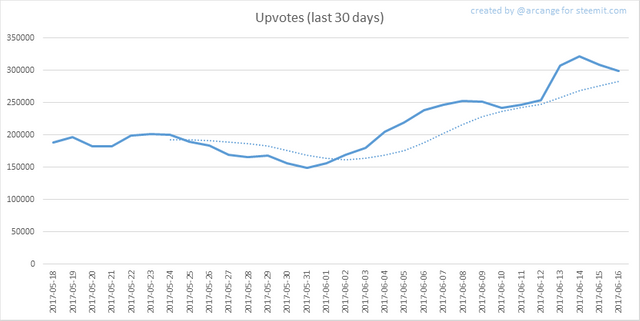
These graphs show the evolution of curation (upvotes) for the whole blockchain lifetime and for the last 30 days
4. Active users
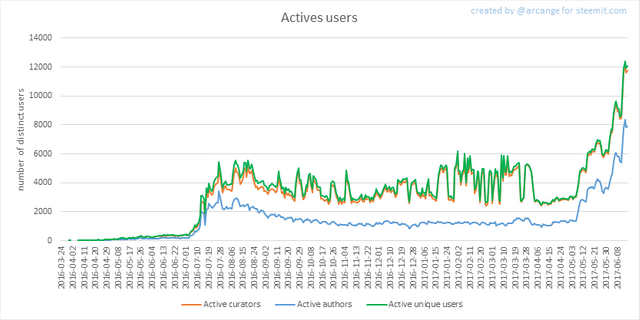
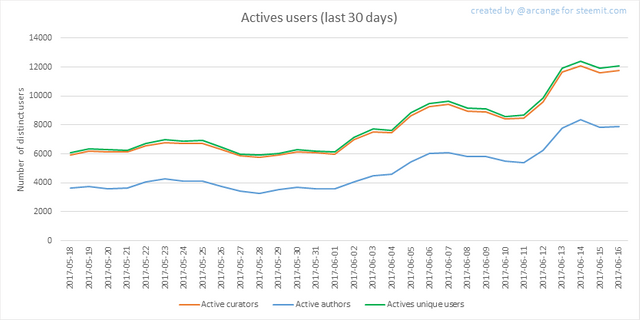
These graphs show the activity of users over time and in more details for the last 30 days.
5. Daily transactions
![]()
This graph shows the number of daily transactions. This give you an idea of the whole activity on the blockchain.
6. Categories
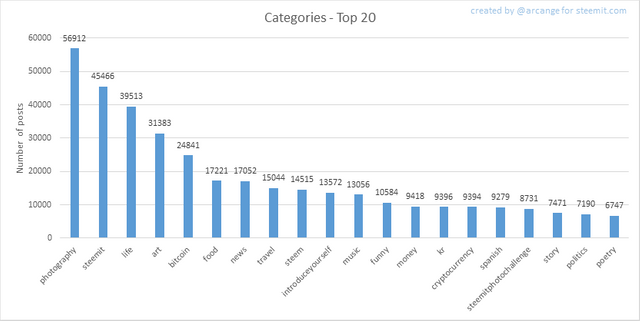
This graph shows the tag has been the most used for publishing posts for the whole blockchain lifetime.
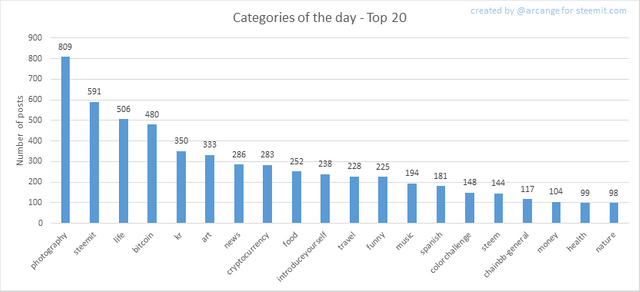
This graph shows the tag has been the most used for publishing posts last day.
7. Distribution
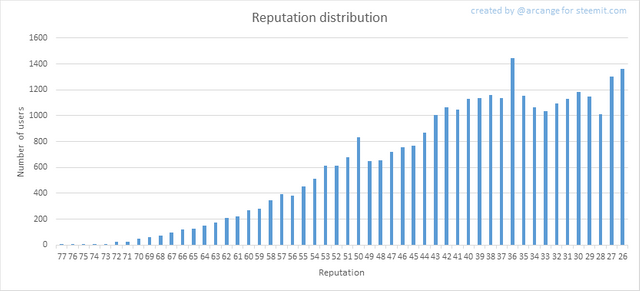
This graph shows the distribution of the reputation among users. Accounts with a reputation lower than 25 have been removed to keep the graph readable.
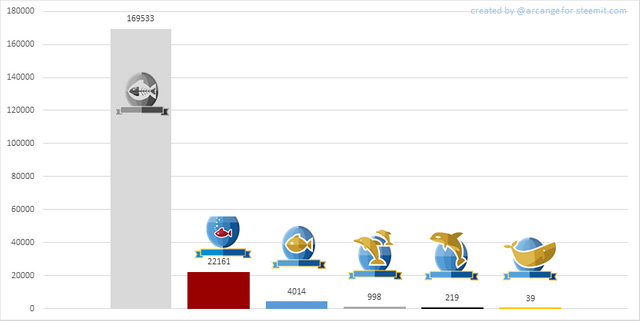
This graph shows the distribution of the voting power (it now includes the new "Inactive" and "Red Fish" levels - check @steemitboard blog for more info about this).
8. Payout evolution
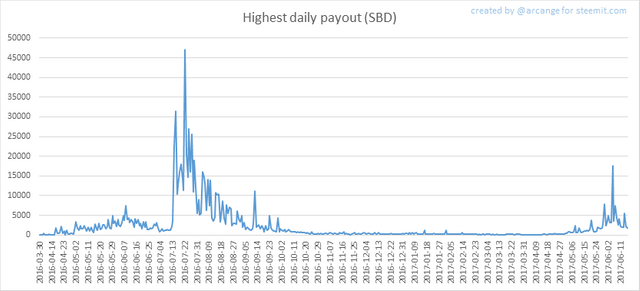
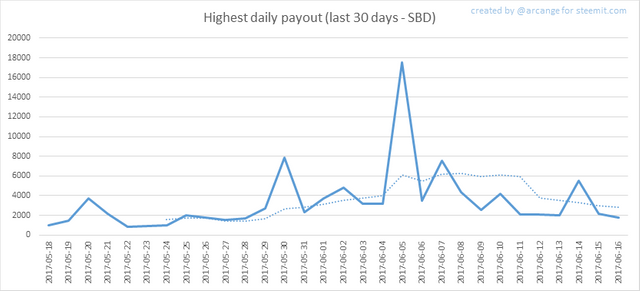
These graphs show the maximum reward paid on a post (or comment) for each day (whole blockchain life and last 30 days).
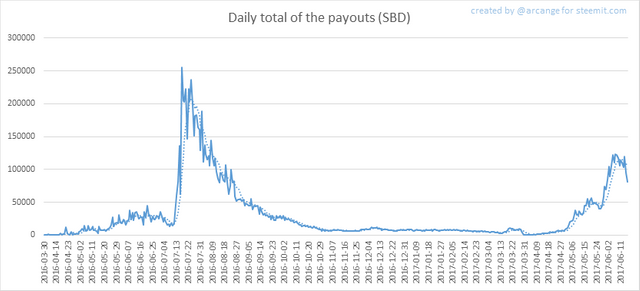
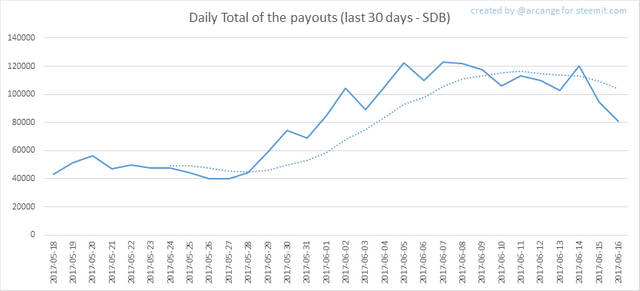
These graphs show the total of the distributed payout (posts and comments) for each day.
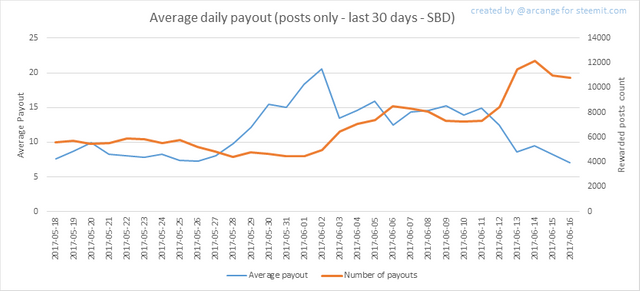
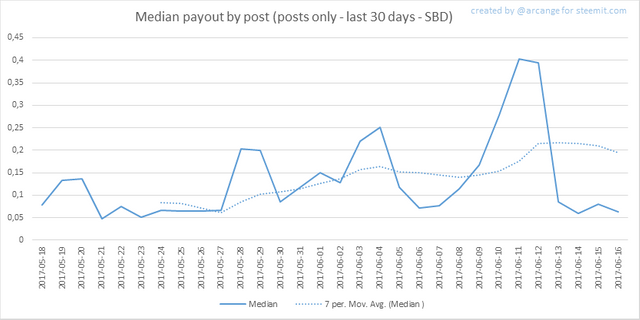
These graphs show the average and median payout per post for the last 30 days.
The last one indicates that if yesterday you got the latest value shown on this chart for your post, you should be happy because there are as much people that have earned more than you than people that have earned less than you.
I hope you find those stats useful. If you would like to see different stats, feel free to drop me a comment. Your feedback is more than welcome.
Thanks for reading.

footer created with steemitboard - click any award to see my board of honor
Support my work as a witness by voting for me here! 
Thank you for sharing these statistics @arcange. It's nice to see that more and more users are joining the Community but it seems like many of them loose interest too soon. This is bad on the one handside if you ask me but on the other side it's as well somehow showing that some Users as well stay only for the Community 🤔
Thanks! We always had a ratio 50/50 active/inactive.
It would be fun to be able to compare these numbers with other social networks like Facebook, Twitter, ...
It would really be interesting to compare this with facebook or twitter. Just to see whether they got the same issue in the beginning or maybe still today so that it might be normal and not due to Steemit offering money...
Hello @arcange
Looking at the figures on graph -number of users- showing registered users versus active users. I am guilty!
Your points are all valid and I agree with all of them.
This remembers me my first steps on platform.
With time, one becomes accustomed and one forgets quickly . But it is good that you remind us the small problems encountered by the newcomers and the fact that it should be improved.
Thanks for your comment.
Daily tranaction graph is not shown
Fixed - Thanks for notifying!
Excellent graphics.
Thanks!
These are interesting stats. Very happy to see Posts and Comments trend (no. 2), but a bit confused reg. Payout Evolution (no. 8).
Does this mean steemit witnessed the boom in Jul-Aug 2016 and has been absolutely quiet till now? With so many whales and dolphins here, why don't we see the spike for a single post payment like last year?
It might mean diversity in today's content or simply that whales and dolphins are conserving their VP! I hope it is the former
The platform paid way too much for some post last year. The economic system (i.e. the underlying code) has been changed to avoid repeating the same mistake and have a better distribution of payout.
@arcange I wonder if last year's huge "payout figures" might have been a good launching strategy. It could look like six months on Beta - attracting all the geeks - then rolling it out so as to attract media attention. Were these huge payout spikes a "surprise" or was it "programmed"?
Either way, it worked and let's hope that steemit is now surfing smoothly enough on its own... merit.
Find this very interesting. As a new user in mid June, it gives one the feeling of getting in at the ground level of a pyramid scheme.
This post has been ranked within the top 80 most undervalued posts in the second half of Jun 17. We estimate that this post is undervalued by $23.80 as compared to a scenario in which every voter had an equal say.
See the full rankings and details in The Daily Tribune: Jun 17 - Part II. You can also read about some of our methodology, data analysis and technical details in our initial post.
If you are the author and would prefer not to receive these comments, simply reply "Stop" to this comment.
I have found these stats very interesting. Its nice to know that whats going on. M a photographer, happy to see the graph of photography high :D
Upvoted n resteemed!
Following u, would love to be followed back.
Thanks you =)
Finding Whale.
Very useful information, thanks for sharing and it is nice to see the community growing so fast.
Impressive stats. They have really gone up in the past few weeks.
Yep, the growth is really impressive and clearly show the potential of this platform. Future will tell ;)