DATA can tell a story! Visualizing science-related Steemit in a few pictures! (2017 First Half)
Recently I've been thinking of playing with the data related to the posts on Steemit under the category "Science" to see if there're any interesting insights. I’ve done some simple work and summarized my findings by visualizing the results in this post. I hope this article can be helpful to you in any way or can provide little information to initiate discussions on how to make the science community grow.
Data source
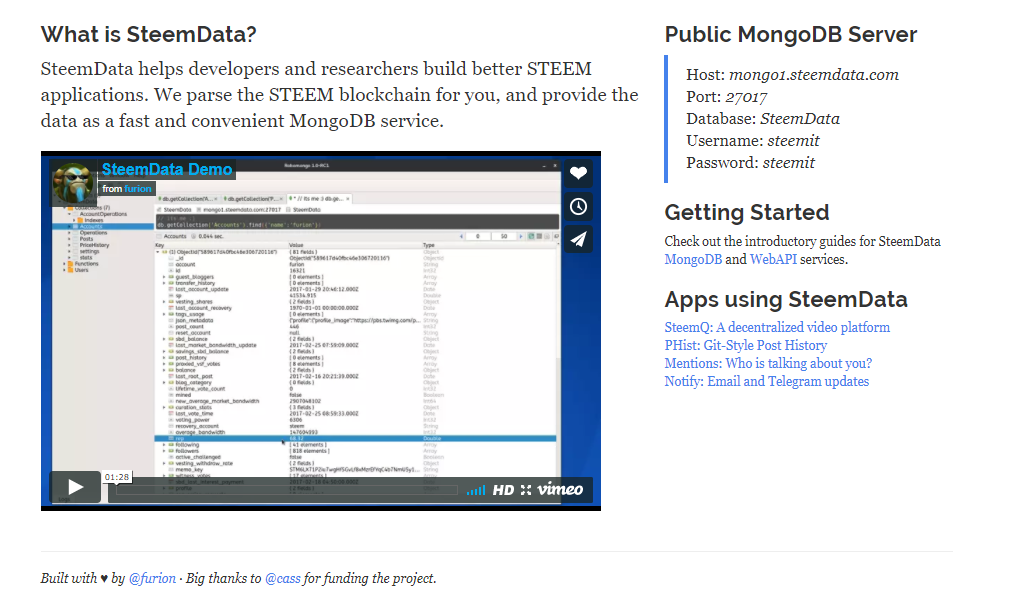
All the data were obtained using SteemData through Python. Thanks @furion for creating such a great application!
Coverage
I extracted all the posts under the category “Science” created between 1 Jan 2017 and 30 Jun 2017, amounting to a total of 4,601 posts. Only the posts created were counted towards the statistics below and all the replies to those posts were not included in my work.
For statistics related to payouts, only the payouts in SBD to the authors were included. If the rewards haven’t been paid out as at the moment when I was preparing the charts, the pending payouts were used as a proxy for calculation.
Let’s visualize!
How many science posts are there?
The number of articles created under the category “Science” per month didn’t exceed 500 in the first 4 months this year. Yet, there were more than 750 science articles in May and the number even surged to approximately 2,100 in June.
I also looked at the payouts for each month in the past 6 months. Surprisingly, the average payout for each post was around 15 to 16 SBD in May and June. However, such averages can be easily distorted by several outliers, who were those authors receiving consistently high rewards. For this reason, I also plotted the median payoffs in the red line, which shows that the median payoff for a science article over each of the preceding 6 months was, unfortunately, close to 0 dollar.
Who are the top authors?
I analyzed the payouts to the authors who ever wrote posts under the category “Science” in the first half of 2017. The following is a simple box plot which shows the distribution of payouts to the top 10 authors with the highest average payoffs over all the science articles posted from January to June. For friends who aren’t familiar with box plots, you may refer to here. In simple words, the longer a box, the more disperse the distribution of payout to the corresponding author is. Moreover, I also plotted the average payouts to those authors in the red line below for easy reference.
When do Steemians often post science articles?
The distribution of the total number of posts by hours is shown in the histogram below. No surprise that there were more posts created during 3 pm to 8 pm than any other time during the study period.
Do posting at certain hours earn more?
Is it possible to earn a higher potential payout by posting a story at a specific time? Let’s have a look at the chart below! It seems like the science articles created between 7 pm and 8 pm received the highest rewards on average. Yet, I also plotted the median payouts in the blue line as a warm reminder that average payouts are easily distorted by extreme values.
What are the most popular tags?
What are the commonly used tags for science articles? To get the answer, I counted the occurrence of each tag for all articles with “science” as the main tag over the past half-year and the top 10 tags are presented in the bar chart below. You may want to notice that 2 or more tags shown in the following chart may be found in a single article (e.g. “technology” and “news” can both be used in an article about tech news) and such duplication was not specially handled. As we can see, in terms of popularity, “life” won the race, followed by “news”, “technology”, “space” and so on. As for the average payout, science posts with tag “steemstem” had the highest average payout despite its least count among the other 9 tags.
The fancy word clouds!
I also hoped to see the most popular words appeared in the titles of science articles. Therefore I scraped the titles of all science articles published in the previous 6 months and created the following word cloud with the help of the Python module “wordcloud”. Apart from the general terms like “science” and “scientist”, it’s interesting to see jargons related to astronomy also had high popularity!

We’ve seen a word cloud for titles. How about the tags? I also took all tags to create a word cloud below to show a number of tags appeared frequently in science articles!

Can we predict the tag given the title only? --- A more advanced topic
Having done several exploratory analyses, I started to think whether it’s possible to give a suitable tag for an article given its title only using some sort of machine learning algorithms (ads time: if you’re interested in machine learning, you can have a look at my previous articles here and here).
I’m not going to do any machine learning but rather I would like to use some tricks to “plot the titles” of articles under different categories on a graph (for technical buddies, basically I used vector representations using a pre-trained model based on Google News Corpus and reduced the dimension using t-SNE embedding). If the titles of articles in the same category are similar in some sense, then they should form clusters on the graph. To see this, I extracted all articles created last month under 5 distinct categories, namely “science”, “art”, “food”, “politics” and “love”. The graph is shown below and there’re really some clusters in several regions (e.g. the red points and green points are concentrated in some areas).
What if I’m not interested in the main category and instead want to give precise tags for a science article? With the use of the same methodology (this time for science articles ONLY), I randomly selected 5 tags and plotted the graph below to see if there would be any patterns. It seems that only the points corresponding to “astronomy” demonstrated some interesting patterns and so assigning accurate tags for a science article by looking at the title only without going through the contents seems to be a difficult task.
Let the data tell stories!
The Steem blockchain contains tons of valuable information which is useful in many ways. The above analysis is just a simple one and a lot more is yet to be explored by you!
If you like my posts, please upvote, resteem and follow me @manfredcml!
如果喜歡我的文章,可以upvote, resteem或follow @manfredcml支持!
Recent articles 近期文章
Does intuition matter in solving problems?
Can Steemit help stop the spread of diseases?
Do you have to be a "genius" to work on machine learning?
Kicking off your first machine learning project is EASIER than you thought!


Great article. I'm happy you informed us in the #steemstem group about it.
Being an economist working with Space Technologies and Satellite Data, I can see so many overlaps in our interests. Having only recently gotten into blockchain, I'm excited to start applying some Data Analytics to the data coming from the steem platform myself, so thanks a lot for sharing!
Followed you and upvoted. Hope to have many more exchanges with you on the platform :)
Thanks for reading @fredrikaa : ) Followed you as well! Hope you enjoy playing around with the data. Apart from visualizing the data, building machine learning tools as add-in to Steemit may be another way of using the data. By the way I'm thinking of how to apply machine learning in topics about economics since there're plenty of such topics in financial economics but seems there're not much about investigating social issues with AI.
It is happening more and more. Although the people with an economics or finance background who also master machine learning and advanced data analytics in R or Python (most just learn analogue tools like SPSS and STATA) usually get sucked up by big banks or big exchanges :P
Grade post
Thank you : )
Congratulations @manfredcml! You have completed some achievement on Steemit and have been rewarded with new badge(s) :
Click on any badge to view your own Board of Honor on SteemitBoard.
For more information about SteemitBoard, click here
If you no longer want to receive notifications, reply to this comment with the word
STOPCongratulations @manfredcml! You received a personal award!
You can view your badges on your Steem Board and compare to others on the Steem Ranking
Do not miss the last post from @steemitboard:
Vote for @Steemitboard as a witness to get one more award and increased upvotes!