What the Bond Market is Telling Us About Assets
(In your dreams, Sam)
What is the Bond Market Telling Us?
For those of you that don't understand the importance of the bond market, let me explain. US Bonds control interest rates in the United States. Unlike stocks and other assets, when bonds are sold, the rates rise. When Bonds are bought, the rates fall. When rates are low, debt is easily created. This makes it cheap for corporations to borrow money and expand, and cheap for first time home buyers to get into a home. But there are negative consequences to this. When money is cheap, there are bubbles created in all assets. Right now we are experiencing an everything bubble. This means that once rates rise and debt starts being created less, these bubbles will start to deflate, since they are propped up by debt.
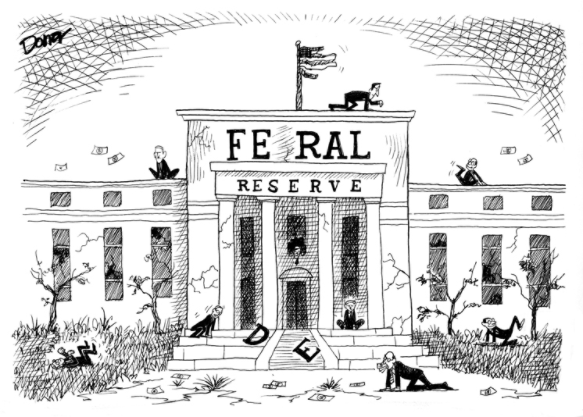
What Role Does the Fed Play in this Market?
The Federal Reserve has the responsibility of keeping the US Dollar, Asset Markets, and other parts of the economy stable. What many don't realize is that economic stabilization cannot be accomplished by a small group of people, the free market must act on it's own, but that's a different story for a different day. The Fed essentially attempts to make an impact in the market by pulling levers and pulleys. They come off as if the decisions they make are calculated, but for the most part, everything they do is guess work. Based off of past economic recessions and expansions, one could argue that they create more volatility and uncertainty for the American economy if anything. As Janet Yellen has decided to begin QT by unwinding their massive balance sheet (selling their current assets) we have seen bond yields rising, which is starting to have an affect on assets. Most assets are in a large credit bubble and it is up to the new chairman stepping in, Jay Powell, to determine what strategy to take as we move forward.
There are two possible outcomes:
- Deflate Asset Bubbles
- Kick the can down the road
In this video, you can listen to Jay Powell's outlook on the economy. He has a very positive outlook on the economy, based off what he says. I get the sense he has a good head on his shoulder and will do everything in his power to keep things stable. However, I can't help but feel he has a bad situation on his hands with all these asset bubbles.
The Everything Bubble:
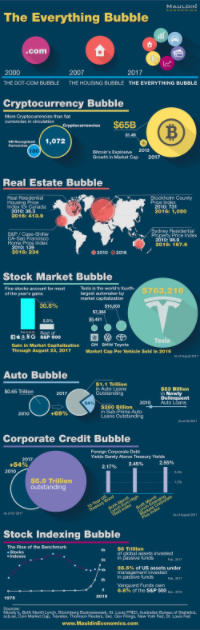
Info Graphic Credit by mauldineeconomics.com
This infographic explains the different areas that this credit bubble is effecting: EVERYTHING. It might do you well holding a good amount of cash over the next 3 to 7 months. I expect a lot of volatility until the bond market stabilizes. Right now there is some panic selling going on. The stronger hands and retirement funds will stabilize this market. And if they don't, the federal reserve will step in and buy up bonds to keep the market up a bit longer. This might not be the end of this great stock market ralley, but I think the new federal reserve chairman, Jay Powell, might be SOL.
It all depends on how Powell wants to handle the issue. He can either choose to kick the can down the road when him and Donald Trump are both retired from office in 2022, OR allow the market to determine fair value by allowing the continuation of QT.
The Fed has gotten it wrong every crash, and I think they are going to get it wrong this time as well. In my opinion, It's looking like asset markets (stocks, bonds, real estate, EVEN CAR PRICES) might be on their last leg.
Bond Market:
- 2.841%
- +0.047 pts
- +1.67%
- Up 40.14% since september
Bonds have been experiencing a massive sell off since September. More recently, the US 10 Year has gone from 2.4% all the way up to 2.84% since the start of 2018.
Market experts have referred to the 2.65% levels for the US 10-year the "line in the sand." Interestingly enough, right as the 10-year passed the 2.65 mark, stocks began to fall.
If rates in the bond market continue to rise, and the fed raises rates this year as planned, volatility may take hold in markets that have generally been on a positive trend for quite some time (stocks, bonds, real estate).
The Fed’s influence (by Marketwatch):
"Why is the yield curve shrinking? Simply put, Federal Reserve policy. The two-year note is most sensitive to Fed policy and heavily correlated to the federal funds rate, as both are deemed to be short-term, risk-free rates. If the yield on the 10-year Treasury note TMUBMUSD10Y, +0.00% which is more sensitive to economic growth and inflation, does not rise as much as the yield on the two-year Treasury note TMUBMUSD02Y, +0.00% the yield curve shrinks .The problem is that the yield curve was a fine indicator of economic performance when the 10-year Treasury note yield was driven by market forces. With quantitative easing, this is not so much the case. When the Fed begins to unwind its balance sheet in earnest, it could also push the 10-year Treasury note yield higher — as it is happening now — in effect, controlling the yield curve and pushing against an inversion, which has preceded every one of the last five recessions."
In other words, as the Fed continues it's tightening policy, they will continue to sell bonds which will push bond rates higher. It is important to pay attention to the 10-year bond as it is sensitive to economic growth. Since bond price actions tend to act earlier than the stock market, we can assume that a rising 10-year rate represents a slow down in the economy in 6-12 months.
The US Dollar:
* stats of 2/2/2018*
DXY:
- 89.19
- +0.54 pts
- +0.61%
The US dollar is, and always has been in a long term down trend. It is a fiat currency. But, during times of weakness in Asset prices reflects strength in the dollar. As we see assets fall, we will witness the stabilization and maybe even rise upward of the US Dollar.
The Dollar Long Term Projection:
At the end of the day, the US Dollar is a fiat currency and is set up to head closer and closer to zero each year. As debt is continued to be created, the dollar has less and less value. That is why when rates are low, it is common to see inflation and the dropping in value of the dollar. When rates are raised, it is common to see short term strength in the dollar as asset prices fall.
Stocks:
The stock market is looking at shaky territory. Currently the S&P 500 is having the beginning of a major pullback at the 9 year market of it's bull run. Bull markets last on average 7-9 years. This fact alone is telling me that the there may not be much more room upwards for the general market. It is interesting to see stock market volatility pick up as the US 10-year continues to rise.
*Performance of stock indexes on Friday 2/2/2018*
*Keep in mind that 2009 was the start of the bull run for stocks*
Dow Jones Idustrial (30)
- 25520.96 points
- -665.75 points
- +2.54%
- P/E Ratio: 22.28
- Up 299% since 2009
According to Investopedia, " The Dow Jones Industrial Average (DJIA) is a price-weighted average of 30 significant stocks traded on the New York Stock Exchange (NYSE) and the NASDAQ. The DJIA was invented by Charles Dow back in 1896."
The Dow on Friday 2/2/2018:
The Dow Jones took a 2% drop on Friday and is down 4% since 01/29.
Nasdaq 100
- 7240.95 points
- -144.91 points
- -1.96%
- P/E Ratio: 27.93
- Up 476% since 2009
The Nasdaq Composite 100 is a list of tech companies in the stock market. It hasn't been around for very long. It is most known for the tech bubble in 2000.
According to Nasdaq.com, " The Nasdaq-100 Index includes 100 of the largest domestic and international non-financial companies listed on The Nasdaq Stock Market based on market capitalization. The Index reflects companies across major industry groups including computer hardware and software, telecommunications, retail/wholesale trade and biotechnology. It does not contain securities of financial companies including investment companies."
A snapshot of the Nasdaq bubble in 2000
The Nasdaq since 2009
S&P 500
- 2762.13 points
- 59.85 points
- -2.12%
- P/E Ratio: 25.50
- Up 291% since 2009
The S&P 500 is an index by Standard and Poors that tracks the 500 largest companies in the US stock market. Investopedia says, " The Standard & Poor's 500 Index (S&P 500) is an index of 505 stocks issued by 500 large companies with market capitalizations of at least $6.1 billion. It is seen as a leading indicator of U.S. equities and a reflection of the performance of the large-cap universe. The S&P 500 is a market value-weighted index and one of the common benchmarks for the U.S. stock market..."
The S&P 500 on 2/2/2018
The S&P 500 since December
The S&P 500 since 2009
The S&P 500 since 1995
Russell 2000:
- 1547.273 pts
- 32.593 pts
- -2.06%
- P/E Ratio: 157.8
- Up 362% since 2009
The Russell 2000 index is an index measuring the performance approximately 2,000 small-cap companies in the Russell 3000 Index, which is made up of 3,000 of the biggest U.S. stocks. The Russell 2000 serves as a benchmark for small-cap stocks in the United States.
This is a great index to use to get a good picture of how most stocks in the US are doing. As you look at smaller and smaller sectors of business, that picture becomes more distorted.
Stocks Overview:
Stocks are long overdue for a bear market. They have been rising since 2009 and are currently in the third longest bull market in 240 years. On top of that, P/E ratios are at 22.3 for the Dow, 27.9 for the Nasdaq, 25.5 for the S&P 500, and last but not least 157.8 for the Russell 2000. For those of you who don't understand what a P/E ratio is, I have an article explaining P/E ratios here. Needless to say, these P/E ratios are clearly high. Though there is room for them to go higher, they show that stocks are not currently at a bargain price. The way that stocks reacted to the 10-year treasury bond yield rising is not a good sign for the future as the 10-year is expected to rise further as the Fed continues to unwind their balance sheet. Be prepared for stock market volatility and the possible beginning of a bear market in 6-12 months.
Real Estate:
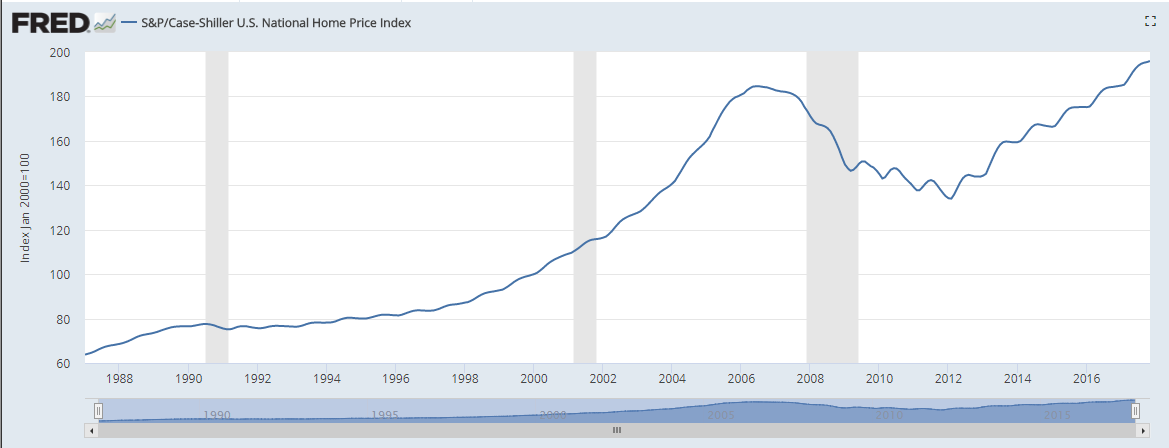
S&P/Case-Shiller U.S. National Home Price Index
At the peak of the housing bubble in 2006, The Shiller Housing Index was at 184 pts. Today the Shiller index is at 195 and climbing. Will it continue to rise? I have a feeling that it is still inflated and will fall when the Fed raises interests rates combined with US Treasury bonds rising.
Eventually, it will become too expensive for buyers in the market to afford a mortgage payment. Then, when rates rise, there will be less upside to buying the house as there is a low chance of the price going up and it is more affordable on a monthly basis for a consumer to just pay rent. This will weaken demand for homes and cause a cascading effect on prices.
Cryptocurrencies:
When watching the cryptocurrency market, it is important to remember that BTC almost acts like an inverse S&P 500 in the way that the rest of the crypto market follows what it does rather than how the S&P 500 represents what stocks are doing.
From January 2016 until December 2017, Bitcoin had gains of 5,900%. The excitement of Bitcoin led to the opening of Bitcoin futures contracts opening up on the Chicago Mercantile Exchange (CME) in December. The same day that Bitcoin opened up on the CME, was the same day that Bitcoin hit it's most recent high. It has fallen 60% since then and hasn't looked back. This leads me to believe that a lot of individuals and institutions have taken short positions on bitcoin, which may be driving the price downward along with the price of other cryptocurrencies.
In my opinion, the crypto market will continue to suffer and will take an even larger blow when the stock market tumbles. Like gold and silver, though, people will rush back into cryptocurrencies as a dollar alternative and safe haven.
The "Big 3" This Past Week:
Bitcoin:
- Bitcoin is down nearly 35% since 01/28
- Bearish Technical Moves
- Weak Buy Volume
- Moderately Strong Sell Volume
Ethereum:
- Down 35% since 01/28
- Weak moves
- Looking Bearish on Tenicals
- Low Buy Volume
- High Sell volume as it heads lower
Litecoin:
- Down 25% since 01/28
- High Buy Volume
- Retested it's previous lows
- Less losses taken compared to other popular coins
Litecoin is looking stronger than the other major coins. I think this may be because of the recent news for the litepay app. This is a payment app that easily allows business owners to accept litecoin and quickly convert it into dollars to prevent exposure to the volatility of the market. You can read more about this news here.
I have always been bullish on Litecoin. It is one of the most known coins, one of the four offered on coinbase. It always follows the general trend of bitcoin, to extremes on both ends. For those of you forex traders out there, I have mentioned before that trading LTC/BTC is great on the swings.
Crypto Market Overview:
Since the start of the day, cryptos are down further with Bitcoin down 10%. Since crypto markets run 24 hours, it is likely this is a preview to what will happen with other asset classes on Monday. Stay tuned.
Precious Metals:
Aw yes, precious metals. Currently the most ignored asset class in the entire markets. During a time of economic uncertainty in 2009, there was a major run up in precious metals. This came to an end in 2011 as Gold has fallen 27% and silver 65% since their highs. Continued long term deterioration of the US Dollar and a weak economic expansion bold well for the metals. Many market pundits have proclaimed the start of the Precious metals new bull run in 2015. We have yet to see this play out, but will NERP and ZERP interest rates by the Federal Reserve, it's hard to see these metals perform poorly in the long run without perfect execution of market manipulation by multinational banks. I think that this bull run in cryptocurrencies may be a test run for what the metals could do in the coming years. Don't you think it's a little interesting that Bitcoin and other cryptos are marketed as gold and silver?

Gold since 1998
Silver since 1998
Gold:
- $1,332.45
- Up 15% since the start of 2017
- Strong support at $1,250 levels
- Great Entry-level Prices
Silver:
- $16.57
- Up 5.44% since the start of 2017
- Support at $16.80 levels
- Great Entry-Level Prices
Precious Metals Overview:
Long-term I am bullish for metals. They have been suffering in rock bottom prices for quite some time. With the easy money policies of the fed, it's hard seeing them stay at these low prices.


Don't sleep on the metals!
Thanks For Reading!


thanks @cryptomeeks lots of interesting info in here. to be honest, everything is a bubble, while accurate, is a bit of a cliche. a lot of people say it but the thing is that with economies around the world (US, EU, Japan and China) all growing at the same time (first time since the financial crisis) there's plenty of fundamental support for inflated asset prices. on some metrics we are 1 standard deviation above mean which is not that much. I do, however, agree that asset prices have been inflated by easy monetary policies globally. With Fed on a hiking cycle and the ECB getting read to start tightening policy, there's less and less support for the markets. So if the fundamentals story becomes challenging then we'll have a problem. Plus, if you look at Fed's history, they always hike either too much or too fast. So, while we are due for a quite substantial sell off in equities, real estate, credit, etc., my bet is that it will come in the second half of 2019 when we have synchronized tightening of monetary policies around the world.
It would make sense for a big sell off to take place when more countries are tightening, but I believe that all central banks are starting this process. And while the everything bubble might be a cliche, the stats don't lie. simply look at the P/E ratio of 147 in the Russell 2000! Look at how just the slightest raise of 0.4% in the US 10-year has effected markets. Like I said in this post, Jay Powell could choose to kick the can down the road, but the credit bubble with deflate eventually.