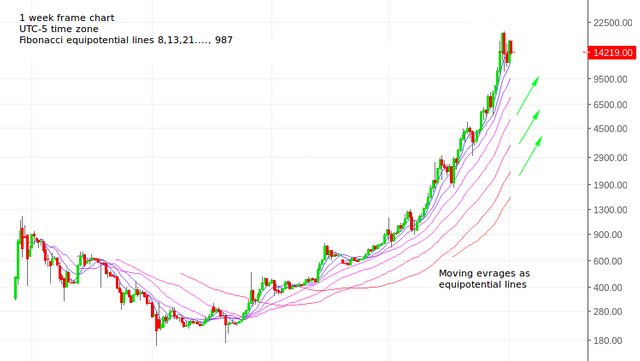
Your reasoning is not so bad. I compose a new way of using moving averages as equipotential lines on price charts. Here is a result:
On this logarithmic scale chart equipotential lines are in the direction of strong uptrend, so viewed from 1 week period scale this is already impressive. This strong uptrend indicated by eq. lines have still great momentum and ranging market of the last month is just an intermecco of continues upwards movement of Bitcoin price.
In the moment only the right entry point have to be predicted for traders to entry.
My last analysis: #25.
p.s. It will be more analysis! My work of past few months to be shared with All Steemians please resteem and let it be of great use TFDSRE: #1, #2, #3.
I 'm grateful for all your support to me!
