Ripple Price Technical Analysis – XRP/USD Bearish Below $0.6500?

boldKey Highlights
Ripple price remains in a bearish zone and is currently trading well below $0.6500 against the US dollar.
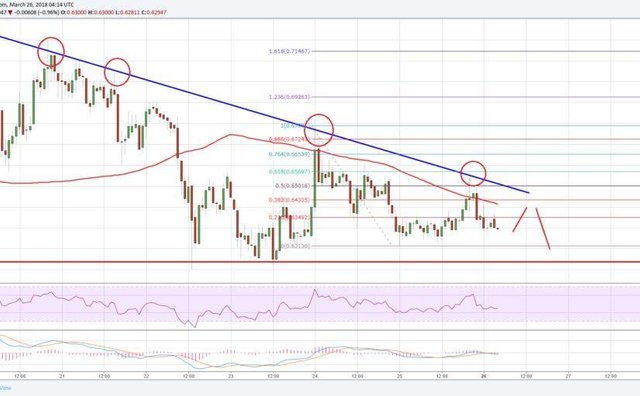
There is a significant bearish trend line forming with resistance near $0.6500 on the hourly chart of the XRP/USD pair (data source from Kraken).
The pair has to stay above the $0.6100 and $0.6000 support levels to stay in a bullish zone.
Ripple price is facing a tough resistance against the US Dollar and Bitcoin. XRP/USD must clear the $0.6500 resistance to start an upside move.
boldRipple Price Resistance
There was a continuous increase in selling pressure below $0.7000 on Ripple price against the US Dollar. The price declined and traded below a key support level at $0.6500. There was also a close below the $0.6400 level and the 100 hourly simple moving average. However, the downside move was stopped near the $0.6000 level and $0.6100 pivot.
The recent low was formed at $0.6213 before the price started an upside move. It traded above the 23.6% Fib retracement level of the last downside move from the $0.6750 high to $0.6213 low. However, the upside move was capped by the $0.6500 resistance and the 100 hourly simple moving average. There is also a significant bearish trend line forming with resistance near $0.6500 on the hourly chart of the XRP/USD pair. Lastly, the 50% Fib retracement level of the last downside move from the $0.6750 high to $0.6213 low acted as a hurdle for buyers.
boldRipple Price Technical Analysis XRP USD
The pair is now in a bearish zone below $0.6500 and the 100 hourly SMA. It has to hold the $0.6000 and $0.6100 support levels to avoid any further declines. On the upside, a break above the $0.6500 resistance is needed for a decent recovery.
Looking at the technical indicators:
Hourly MACD – The MACD for XRP/USD remains in the bearish zone.
Hourly RSI (Relative Strength Index) – The RSI for XRP/USD is now well below the 50 level.
Major Support Level – $0.6000
Major Resistance Level – $0.6500