AC Circuit Analysis using Scilab

| Intended Learning Objectives |
|---|
| At the end of the tutorial, readers should be able to learn how to: 1. solve equations with complex numbers involves; 2. perform the AC circuit analysis using Scilab; 3. Plot a graph for the voltage values using Scilab. |
| II. Requirements |
|---|
 (image credited to scilab.org)To be able to follow the discussion and tutorial, readers should have a desktop PC or laptop ( Windows 7, 8, or 10) and an installed a latest Scilab (an open source high level numerical analysis and programing) app either 32 or 64 bit that can be downloaded at scilab.org. |
| III. Difficulty |
|---|
| Intermediate |
| IV. Introduction |
|---|
In AC circuit analysis, capacitance and inductance connected in a circuit is represented by an imaginary values ( j ). This is due to its ability to either store or absorbed energy. So, for this tutorial, we will conduct an circuit analysis that involves complex numbers to represent the capacitors and inductors in the circuit. By the way, complex numbers involves with the imaginary number j or i which represents square-root of 1. For this tutorial, we will use Scilab to perform the circuit analysis by taking on a specific problems. Basically, we will be using the matrix and complex functions in the Scilab. |
| V. AC Circuit Analysis |
|---|
In the circuit of the figure shown below, let take v = 4 cos (5t -30) V and i = 0.8 cos 5t A. We will find v1 and v2. 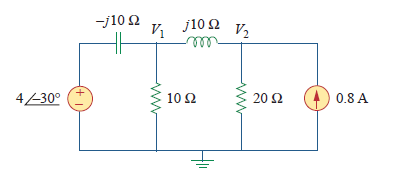 The circuit shown is already in the frequency domain so we do not need to convert it. If you take a look at the circuit, you can find a reactance values for capacitor and inductor equal to -j10 and j10 ohms, respectively. This values are in the complex form. Before we do the implementation in the Scilab, we will need first the equivalent equation that will represent the circuit. So, we will perform Nodal Analysis.  At node v1, we sum up all current entering the node equal to current leaving the node, which is indicated by the read arrows in the figure. Then, we derive the following equation:  At the same time, we will also perform nodal analysis on node v2.  Equate the sum of all currents entering and leaving the node. You will have the following equation after:  We will write the equations into a matrix form that will be used in the implmentation later on.  |
| VI. Scilab Implementation |
|---|
We have identified the matrix form of the equation we have derive in the prior section. From the matrix form of the equation, we will set to matrix variable in our Scilab code. We will take the variable coefficient matrix as A and the constant matrix B. In writing it as a Scilab code, we will combine the basic Scilab array and complex syntaxes. A = [ complex( Real value1, Imaginary value1), complex( Real value2, Imaginary value2)];Now, we write the actual code as: A = [ complex( 0, -1), complex( 1,0); complex( -2, -0), complex( 2,1) ];B= [ complex( 3.486, -2), complex( 0,16)];The current matrix the we have derive from the nodal analysis could be summarize as AV = B. We will use the Scilab to invert and multiply the inverse to B to get matrix V, which contains the voltage v1 and v2. To inverse matrix A, use the code: inv( matrix identifier);. At the same time, to be able to multiple matrix A and B, we need to transpose matrix B. Transposing matrix B, use matrix_identifier(:). Now, completing the mathematical implementation code, we write it as V = inv(A)*B(:);Next, we will display the values for v1, v2, and, matrix A, B, and V. Writing the code as: disp ("Matrix A: ")disp(A)disp ("Matrix B: ")disp(B)disp ("Voltage v1: ")disp(V(1,2))disp ("Voltage v2: ")disp(V(3,4))Here is the complete code. A = [ complex( 0, -1), complex( 1,0); complex( -2, -0), complex( 2,1) ];B= [ complex( 3.486, -2), complex( 0,16)];V = inv(A)*B;disp ("Matrix A: ")disp(A)disp ("Matrix B: ")disp(B)disp ("Voltage v1: ")disp(V(1,2))disp ("Voltage v2: ")disp(V(3,4)) The result after implementing the code in SciNotes and run in Scilab Console. 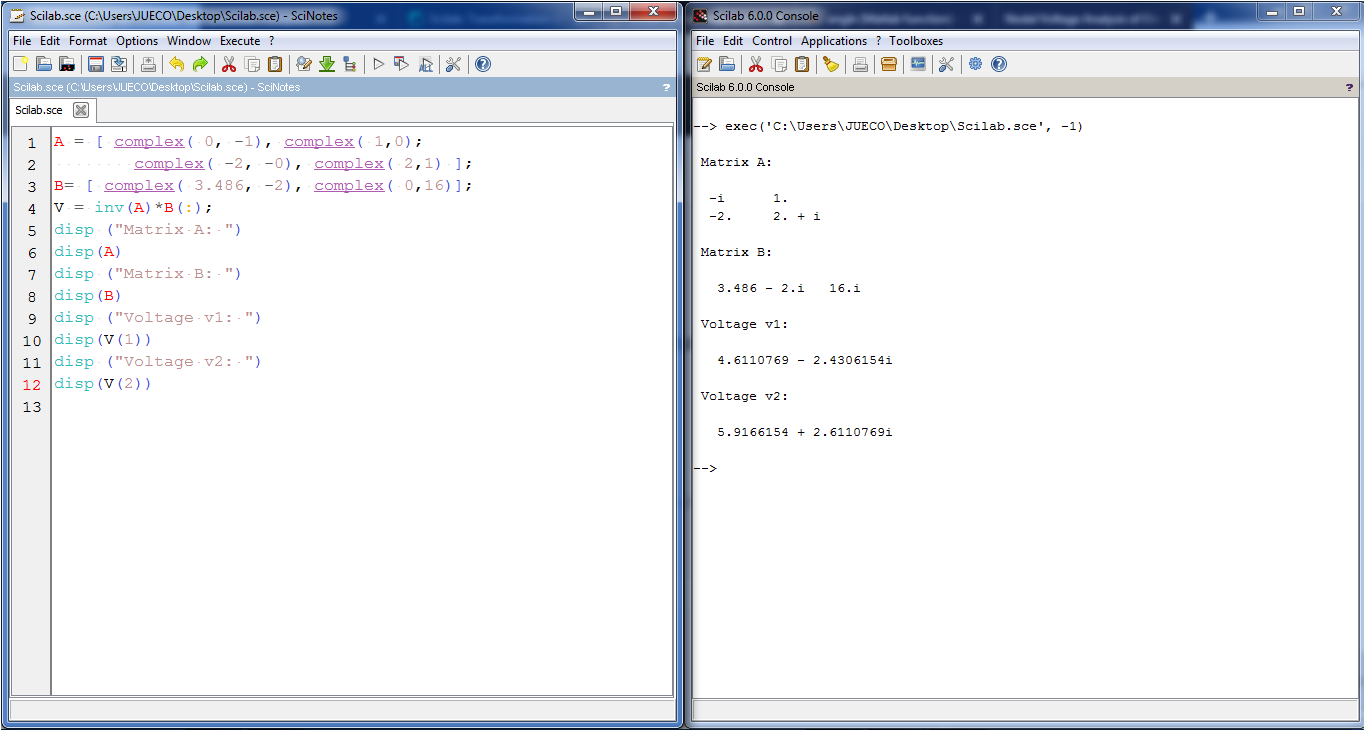 |
| VII. Plotting the Voltage values | |||
|---|---|---|---|
In this section, we will implement a code that will plot the voltage V, V1 and V2 with a specified time frame t = 10 sec, step = 0.01 at 60 Hz. Solving for the angle between real and imaginary values of voltage v1 and v2. We will use atan((real(V(1))/abs((V(1))))) . The syntax real() will determine the real value of the voltage, while abs() will get the resultant vector between the real and imaginary values. On the other hand, atan() is equal to trigonometric operation inverse tangent. So, we write the complete code as: v1=atan((real(V(1))/abs((V(1)))))*(180/%pi)v2=atan((real(V(2))/abs((V(2)))))*(180/%pi)To plot the voltage values, initials t = 10. We write the code as t=[0,0.1:10] which set the plot from 0 sec to 5 sec. Initialize voltage V, V1, and V2 with the voltage formula:V=4* cos (5t -30);V1=abs(V(1)* cos (5t -v1);V2=abs(V(2)* cos (5t -v2);Now, plotting the voltage, we will use plot() that will plot a 2d graph for the voltage. plot(t,V)plot(t,V1)plot(t,V2)The result after implementing the code in Scilab.  Below is the complete code for plotting and displaying the graphical presentation of the voltage values in Scilab. v1=atan((real(V(1))/abs((V(1)))))*(180/%pi)v2=atan((real(V(2))/abs((V(2)))))*(180/%pi)t=[0,0.1:5]V=4* cos (5t -30);V1=abs(V(1)* cos (5t -v1);V2=abs(V(2)* cos (5t -v2);plot(t,V)plot(t,V1)plot(t,V2) 
Posted on Utopian.io - Rewarding Open Source Contributors |

Thank you for the contribution. It has been approved.
You can contact us on Discord.
[utopian-moderator]
Thanks @cha0s0000
Hey @cha0s0000, I just gave you a tip for your hard work on moderation. Upvote this comment to support the utopian moderators and increase your future rewards!
Being A SteemStem Member
You got a 68.97% upvote from @steembloggers courtesy of @juecoree!
Hey @juecoree I am @utopian-io. I have just upvoted you!
Achievements
Community-Driven Witness!
I am the first and only Steem Community-Driven Witness. Participate on Discord. Lets GROW TOGETHER!
Up-vote this comment to grow my power and help Open Source contributions like this one. Want to chat? Join me on Discord https://discord.gg/Pc8HG9x
Resteemed your article. This article was resteemed because you are part of the New Steemians project. You can learn more about it here: https://steemit.com/introduceyourself/@gaman/new-steemians-project-launch . If your post has more upvotes, your post will appear in the trending page. To get more upvotes, you can bid for @steembidbot vote. please check it out here: https://steembottracker.com/