Understanding Cryptocurrency Trading signals — Dows Theory and it’s 6 tenets in 500 words
The objective of this article is to explain the six tenets of Dow’s theory and how they can be used to analyze cryptocurrency trading signals in 500 words.
I will be using short sentences so that it is easy to grasp and understand.
I will be using BTC charts from Bittrex.com for illustrations.
For a detailed overview, please visit the sources attached after the explanation.
Charles Dow is known as the father of technical analysis and him along with Edward Jones created the Dow and Jones index.
While observing the markets he developed a series of 6 tenets which are now the basis of technical analysis.
Understanding these 6 will change the way you analyze markets.
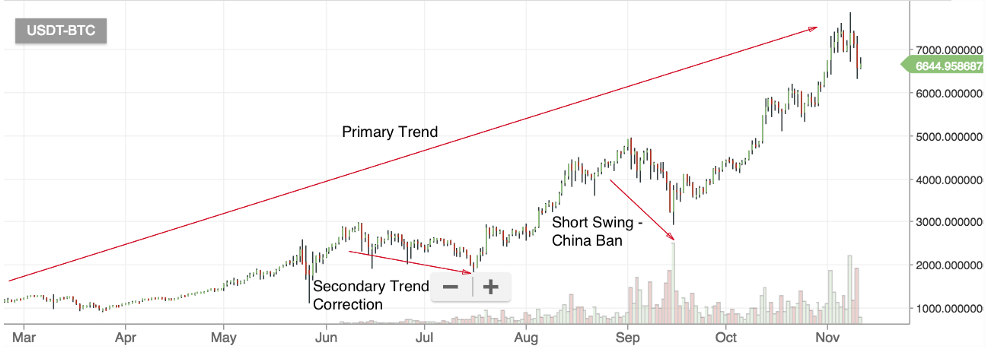
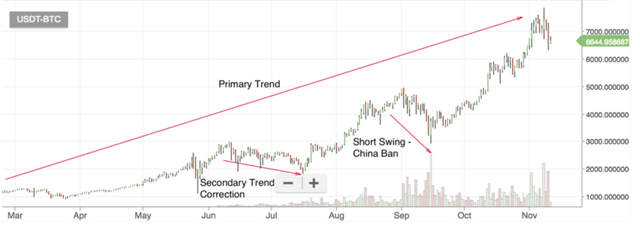
1. The market has 3 trends
Primary trend — It’s a major trend that is in the market and may last for a year to 3 years. E.g BTC is in a bull trend since Jan 2017.
Secondary Trend — This is the retracements or corrections which keep on happening in the primary trend. The time varies between a few days to a few months. E.g. Whenever BTC price hits a major resistance it falls (retraces 33% to 66% and then rebounds).
Short Swings or minor movements — this varies with news and opinions and lasts for a few hours to a month. E.g. when China banned BTC it went down to $3300 or when the hard fork was suspended it traded up to $7800.
 .
.
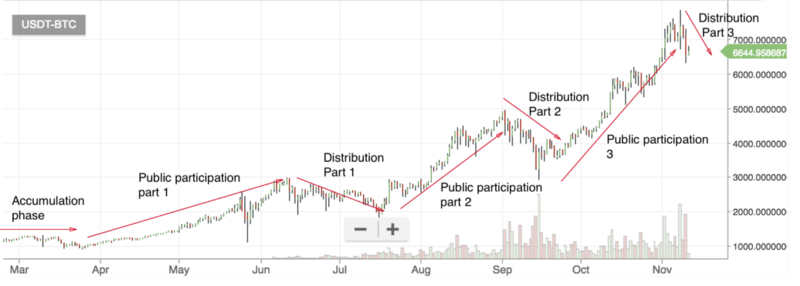
2. Market Trends have 3 phases
Accumulation phase — When investors who see the future and understand what is happening (insider information holders and good analysts) buy a coin at low prices. E.g. BTC buying and accumulation up till 2016
Public Participation Phase — When the public starts seeing the value in a coin and starts buying it which results in the price of the coin increasing. E.g BTC rising to $1800 then $2900 then $4000, $5000, $6000 and so on
Distribution phase — Distribution phase is when people who accumulated start selling after booking profits. E.g. This has not come in BTC yet, but it can be observed in people who got BTC cheaply, and distributed a part of when it hit major resistances in public participation phase.
3. The markets are efficient — It means that all the fundamental information and news about a coin will reflect in the price of that coin. So effective technical analysis can help traders effectively overcome the fundamental information gap.
4. Market averages must confirm each other — This means that if the market averages show opposite trends then it is not a clear signal of any trend.
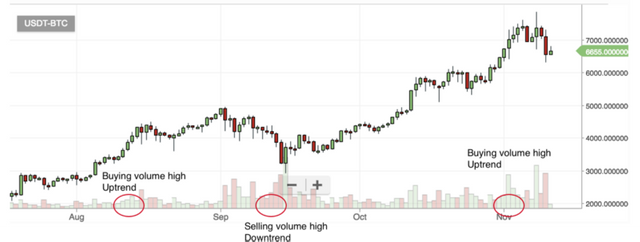
5. Trends are always confirmed by Volume — An uptrend is confirmed by increase in buying volume and a down trend is confirmed by increase in selling volume.
6. A trend does not change until there is a clear signal of reversal — Trends exist despite noise. Dow believed that until there is a clear signal showing reversal the trend should be given a benefit of doubt.
E.g. A bullish trend will have a higher high and a higher low. For a trend to change there has to be a lower low confirmed by lower highs.
For a bearish trend it will have lower low and lower high. For a trend to change there has to be a higher high confirmed by a higher low.
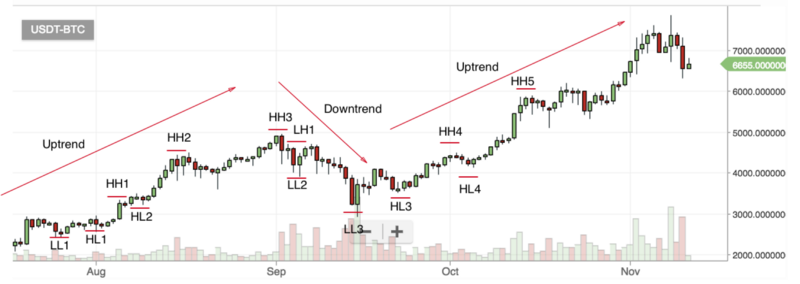
BTC chart 1 day interval — Moving from downtrend to uptrend — Lower Low 1 (LL1) to Higher Low 1 (HL1) and Higher high 1 (HH1), to HL2 and HH2. Moving from Up trend to downtrend — Higher High 3 (HH3) to Lower High 1 (LH1) along with Lower low 2 (LL2) and Lower low 3 (LL3).
I
would love to answer any questions you have on Dow’s Theory and how to use it. Please ask any doubts you have in the comments below. I would also like any feedback you have to improve the way I explained the six tenets.
Full Disclosure —This blog is written by advisor of stature.network on medium
Stature.Network can help you figure out what should be your next crypto investment.
It does this by curating, actionable, cryptocurrency trading signals being given by the top 1% traders in the world.
You can Join the community on Facebook
If you liked the article recommend it give it a few upvotes :)
