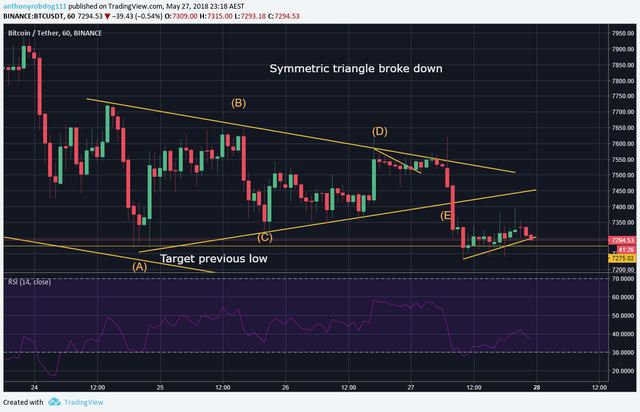
BTC: What do we need to see to continue this bearish trend? +trade review
It is important to be reactive and aware of the various scenarios that may play out, you can not entirely predict the market instead It is crucial to have no bias as a trader and entertain both bullish and bearish scenarios, we are not fortune tellers. Traders are proactively-reacting to new data in the charts and must rule out counts based on this information. I like to think of trading as a puzzle that is constantly evolving, with the prize of solving it being a moment in which price actions can be easily predicted and profits made.
For example: TRADE REVIEW.
Symmetric triangles are neutral and playing this short on BTC was very simple.
I used two main indicators being the candlesticks and the trend line breaking.
The two large candlestick wicks indicate that the bulls have attempted to push price up but failed, and then the breaking of the trend line on a drawn e wave further supports the possibility of a down trend. Profit taking points were also simple to derive through finding the recent low and placing buy orders there.
ALSO: To support the possibility of a bearish break of the triangle the elliot wave count I was primarily using indicated that this was the wave four correction, leading to a wave 5 downward. As seen in chart 2.
Chart 2:
Now, where is the bottom for BTC. I am currently using 3 main counts, Chart 3 being my current highest possibility count and the short term minimum being 7000-7100
Chart 3: VERY BULLISH
If BTC can touch this trend line and bounce off with high volume, this would be an extremely bullish indication, it would be triple bottom and this means that bears are unable to push the price any lower and are losing steam. There are a lot of indicators that suggests support here, fib rations 0.786, fib extension of the first wave, price action support, RSI resistance etc... However we must still be prepared for a more bearish scenario, even if unlikely.
Chart 4:
I have placed very little thought into the supports for this count as I see it as unlikely but if it does occur, the supports will be at the previous lows, and if those are broken our next support is 5K aproxx, I will provide further updates on this when and if it does happen.
Overall in the long term I am very bullish


