BTC UPDATE: probability of an uptick?
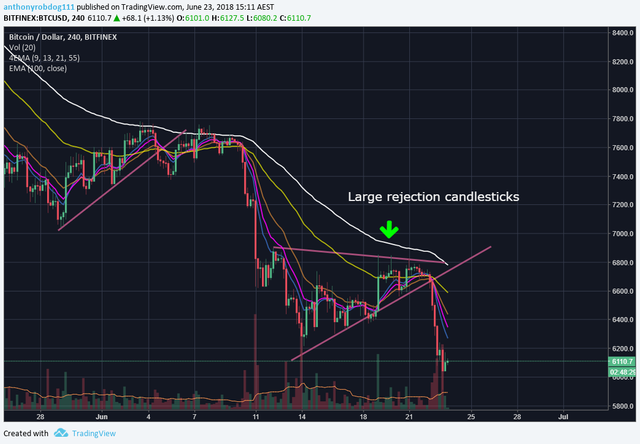
BTC: has broken through this previously established triangle, which to me resembled a bear flag. We can see that at the peak of this flag large rejection wicks were formed off the 100 EMA further hinting this downtrend.

Following on from this we have reached a new bottom at the 6K region, in which unsurprisingly large volume has come in as this is a very significant level as it was the previous February bottom. however it is possible for the price to drop significantly past this level I'm of the opinion that we will see higher price action first, possibly up to around the 7K region.
To support the idea that a temporary bottom has been reached and that price action may increase I refer to browns RSI rules, as we look on the 4 hour chart below: This rule states that positive divergence in the RSI (as seen by the positive trend) coinciding with negative price movement (as indicated by the negative trend in price) , is often a leading indicator for price action reversal. Furthering this point is the extreme lows we are currently seeing on the RSI.


Please Upvote➜https://steemit.com/christianity/@bible.com/verse-of-the-day-revelation-21-8-niv