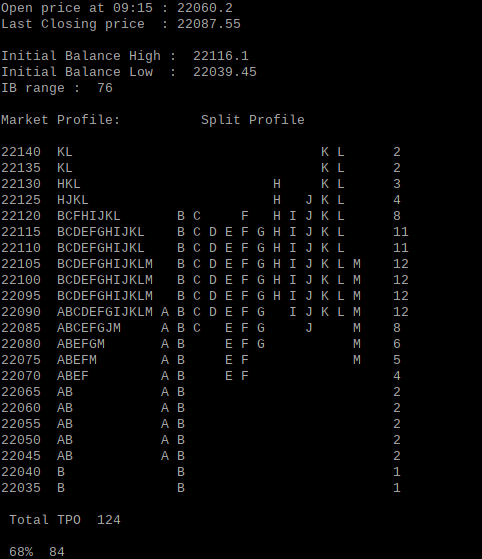
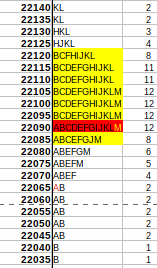
market profile chart for nifty fut 16 feb 2024
Nifty futures
poor high at 22140
prominent point of control at 22090
16 feb 2022 tpo up/tpo down = 77/33. from this sellers are dominating
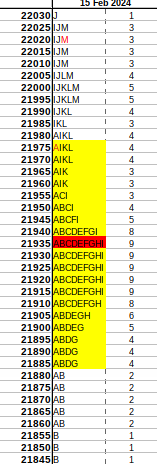
when we compare current day close 22087.55 with current day value are which is near the poc and val we find the market confidence is weak but when compared with 15 feb22 value area 16feb22 close is above prior yesterdays value area.
15 feb 2022 tpo up/tpo down = 71/77


