A few currencies about to move...
Hello Steemians!
Today I would like to share a few trade set ups that I will be testing tonight.
USDJPY
I tried to go short this pair last week. I didn’t get the downside move in the time that I expected, so I exited the trade at break-even to wait for a better opportunity. Today may be that opportunity.
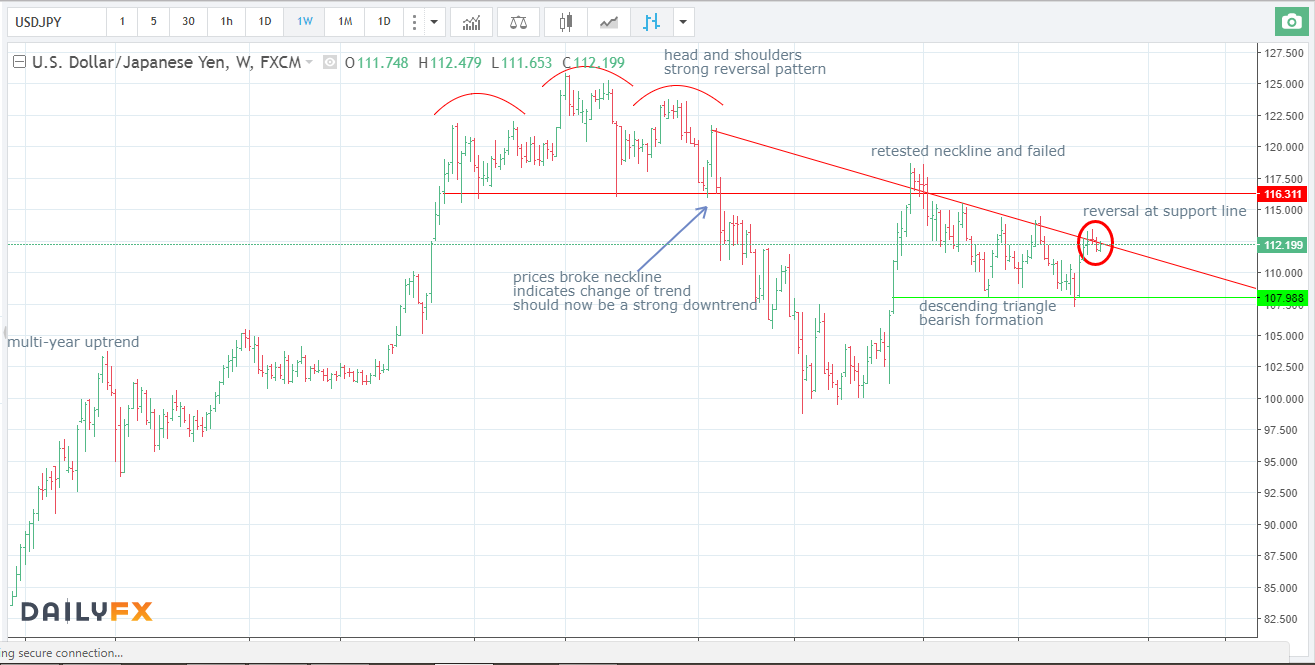
The weekly chart is below:
After a long uptrend, a clear head and shoulder pattern formed. This was confirmed by the breaking of the neckline. Prices then retraced back to that neckline, and turned back downwards, confirming that the pattern still holds. This indicates lower prices and a downtrend should now be in play.
Furthermore, a descending triangle (another bearish pattern) has been forming recently, and we recently had a reversal off the top of the formation at the resistance line. This indicates a likely fall down to at least the support line (green) and eventually much lower.
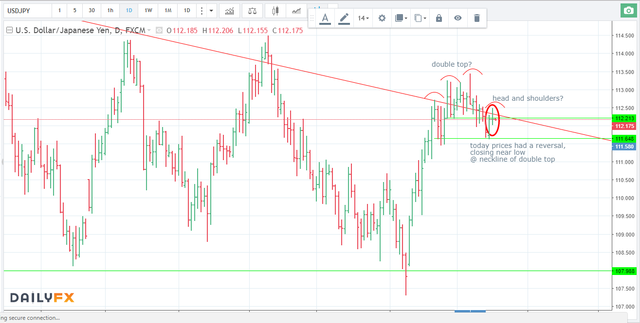
Below is the daily chart:
Prices have been hanging around the descending resistance line for a while now, but have been unable to break to the upside. Today’s reversal was the latest in a series of reversals at this level, and shows a possible head and shoulders pattern forming at the resistance line. When we notice patterns within a pattern, both pointing in the same direction, this can be a very powerful signal. When we combine that with today’s price action, we much test the downside of this pair.
USDCAD
This is another pair that we tried last week, and took a small profit from. I closed it as it seemed that it wasn’t ready to fall just yet. The next day we would have been stopped out of the trade. However, the CAD showed some strength today and the time has come to retest the downside of this pair
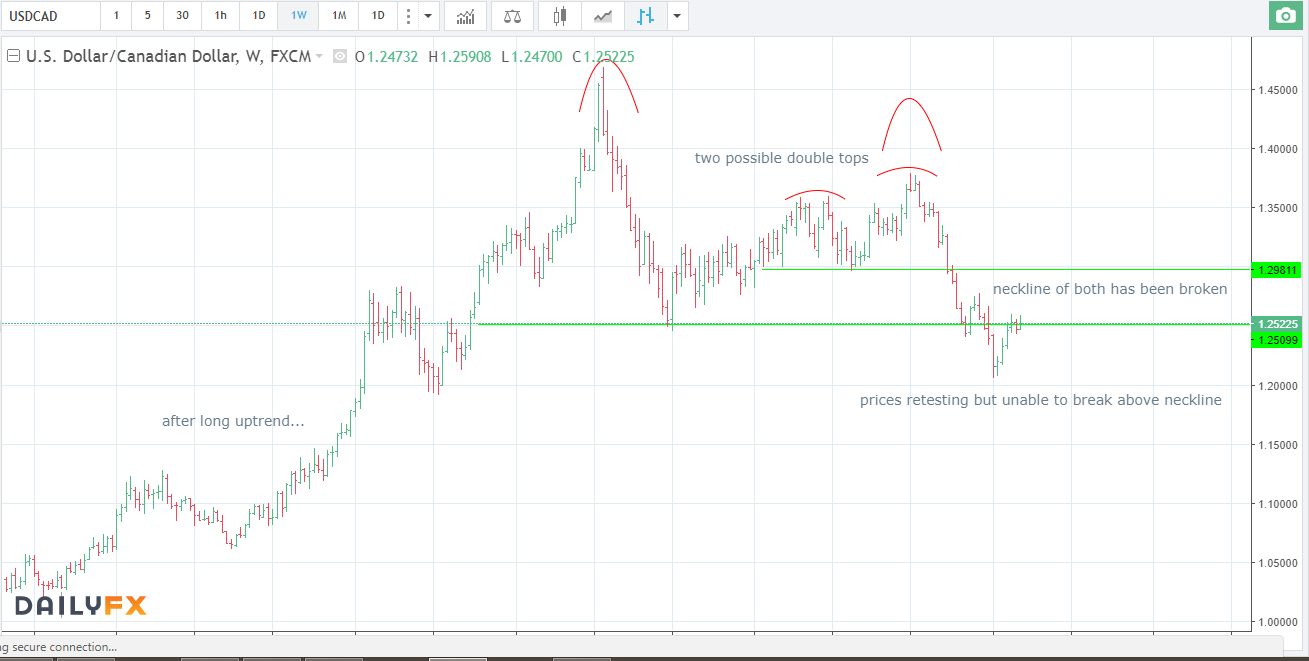
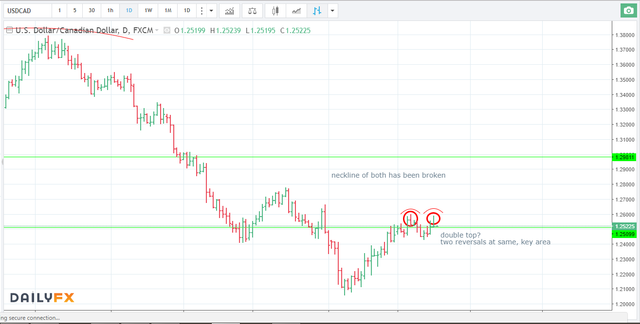
After a long uptrend, this pair put on a strong double top, and broke through the neckline recently. It has since risen to retest that key level, but has been unable to make any progress to the upside. The daily chart below shows more details:
You can see the presence of a possible double top at this key area, with two reversals occurring shortly after one another. This pair may now be ready to continue its downtrend, and we have to test out such a strong signal.
CADJPY
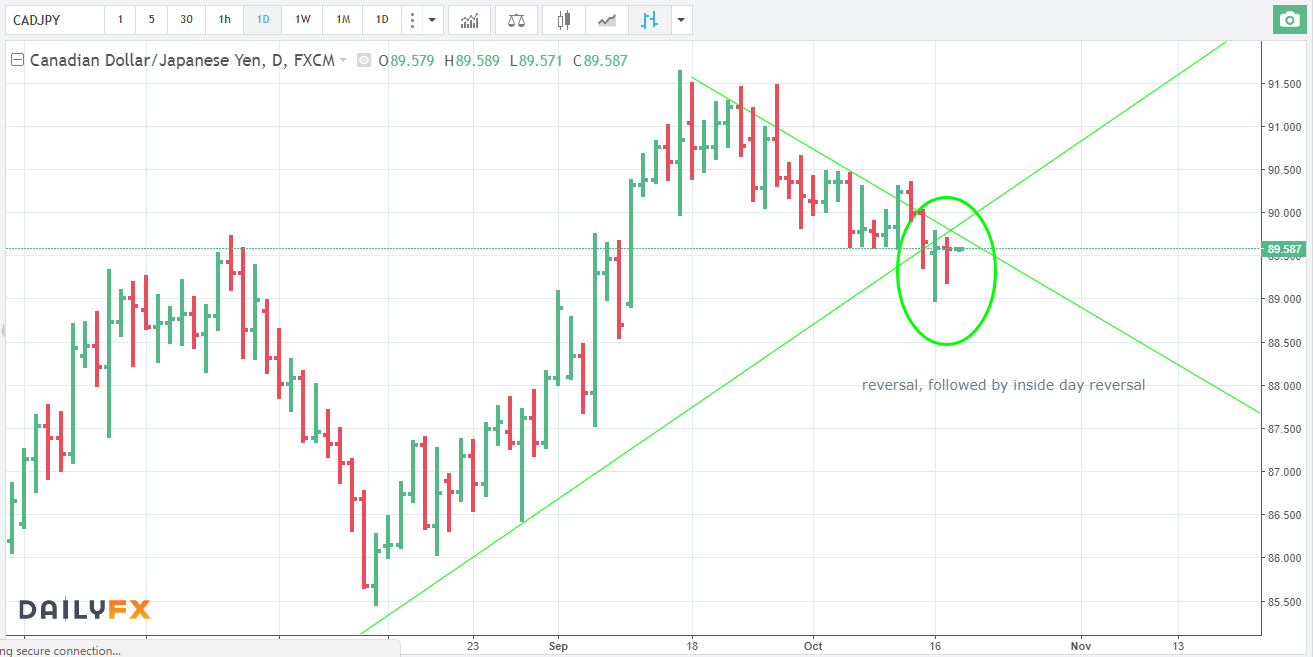
I tested the upside of this pair last night. I was not entered into the trade as prices did not rise. However, today there was an inside bar, with prices ranging between the high and low of yesterday, and prices closed near the high of the day. This, combined with the reversal yesterday at a key area, encourages me to try the long side of this pair again. Below is the daily chart showing today’s price action. Yesterday’s analysis is below that.
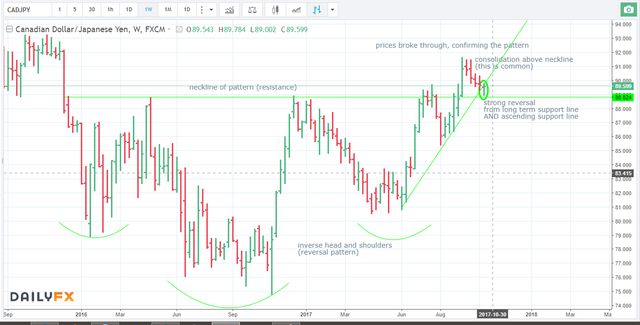
The weekly chart is below. Large inverse head and shoulders pattern which is a strong reversal pattern. The prices broke the neckline resistance area a few weeks ago, and have been consolidating with small ranges since.
P.S.
Trying out this new logo, what do you all think?
Follow me for more posts about the currencies and commodities markets and trading in general
All information within is opinion and is for informational purposes only. The purpose is to educate you on how I select trades so that you can learn to choose your own. No information provided is intended as investment advice. You should seek the advice of a licensed professional investment advisor for investment advice. Please do not risk more than 1% of your total account per trade. The total value of your account should be money that you can afford to lose without affecting your lifestyle or future. If you are uncomfortable with risking your money or not experienced with trading, please use a demo account with your broker while you learn.

Hi, oroblanco! I just resteemed your post!
I can also re-steem and upvote some of your other posts
Curious? Check out @resteembot's' introduction post
PS: If your reputation is lower than 30 re-blogging with @resteembot only costs 0.001 SBD