The Triangle 🔺 - The 'Simple to Understand' Trading Indicator
Triangles are simple to spot!
You know what a triangle is. If you don’t, then go back to kindergarten and learn what the geometric shape is. Geometry is used a lot in trading and today, we will discuss why a triangle is important and can vastly help your trading.
One thing to remember is that when you are looking for a triangle, the most important concept is to be looking for trades IN THE OVERALL DIRECTION OF THE PREVAILING TREND. If you do this, you will save yourself a lot of heartache.
Below is an example of a triangle in trading.
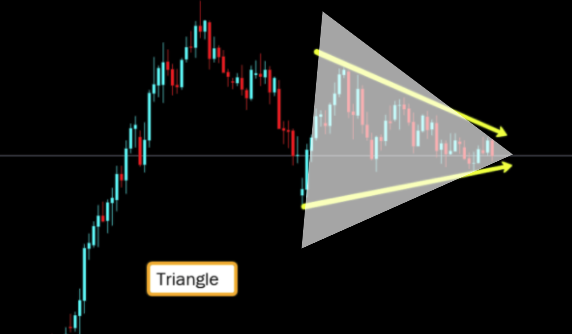
Here is how to spot your own:
Step 1 – Look for 2 or more points on the bottom side of a chart formation that forms an upward sloping line.
Step 2 – Look for 2 or more points on the top of a chart formation that forms a downward sloping line.
The End.
Another Example
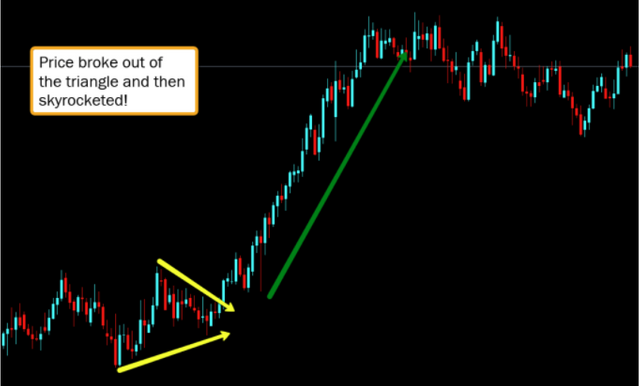
Look at the picture. As soon as buyers pushed it up where the sellers did not want to hold it, the sellers gave up, stop losses were taken out and price just skyrocketed! Sellers abandoned ship and now came into the buying zone and started buying, instead of continuing to sell.
This extra buying pushed price up more and more.
This is the power of triangles. Whether ascending during an up trend or descending during a down trend, it always looks the same. It is very difficult to find a “perfect” triangle but remember this… When price is converging and consolidating, watch out because when it breaks, it has a tendency to move in a big way.
Happy Trading!

Hi! I am a robot. I just upvoted you! I found similar content that readers might be interested in:
https://traderbotmarketplace.com/what-is-a-triangle/
yes thats mine. i am moving over content from wordpress to steemit