Why You’re Losing Trades — And How Technical Analysis Can Fix It
In the world of trading, charts tell a story. But without a solid grasp of technical analysis, it's easy to misread that story --- or miss it altogether. Whether you're new to trading or looking to sharpen your edge, understanding these five principles will help you make smarter, more strategic decisions.
1. Start With Top-Down Analysis: Follow the Bigger Picture
Before zooming into 5-minute candlesticks, start with the larger time frame (daily, 4H, or 1H). This is where the overall trend becomes clear.
- Trend-Following Setup: If the trend is bullish, look for price retracements that consolidate and reverse back up from demand zones. Enter when large momentum candles confirm the continuation.
- Reversal Setup: Want to go against the trend? Wait for confirmation. Look for a Break of Structure (BoS) --- a previous swing high or low getting taken out. A liquidity grab (where equal highs/lows are swept) strengthens the reversal case.
👉 Pro Tip: A shift in momentum confirmed by large, full-bodied candles (with minimal wicks) often signals a high-probability entry.
2. Supply and Demand Zones Are King (Not Just Support & Resistance)
Many traders confuse supply and demand zones with traditional support/resistance lines. Here's the distinction:
- Support/Resistance: Horizontal price levels where price reacted in the past.
- Supply/Demand: Zones where aggressive institutional orders were placed, often leading to strong impulses.
To trade effectively:
- Mark the demand zone before a bullish impulse or the supply zone before a bearish impulse.
- Use these zones to anticipate where price may react next.
These zones offer context: Are we retracing into a demand zone for a bounce? Or has price entered a supply zone, suggesting a potential drop?
3. Momentum Candles Tell the Real Story
Not all candles are created equal. Momentum candles --- those with large bodies and small wicks --- tell you a lot about who's in control.
- Bullish momentum: Big green candles breaking through prior resistance, often seen during a continuation of trend.
- Bearish momentum: Long red candles with conviction, signaling strength in a downtrend or a reversal.
Look for these candles as confirmation signals --- especially after entering a supply or demand zone, to guide your decision on whether to long or short the market.
4. Watch for Liquidity Grabs Before Reversals
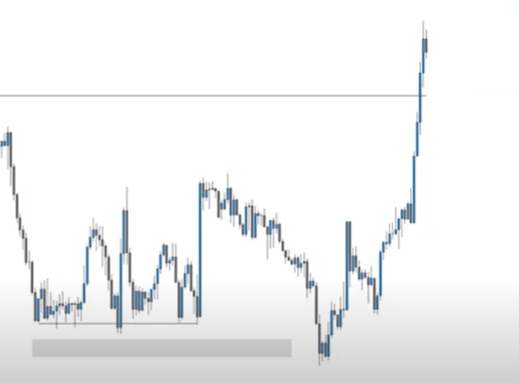
The market often takes out equal highs or lows to trap traders before reversing. This is known as a liquidity sweep.
For example:
- Price forms an apparent suspport level with equal lows→ retail traders place buy orders, with stop losses below this support level.
- Price breaks below the lows (taking out stop losses) → then pumps hard.
- The zone before this bullish impulse becomes a demand zone.
This move often precedes major reversals and is a favorite tactic of smart money.
5. Combine Structure, Zone, and Candle Clarity
Your highest-probability setups come when all elements align:
- Market structure shows a clear trend or reversal (BoS).
- Price enters a refined supply or demand zone.
- A momentum candle confirms the direction.
This trifecta is your confluence --- and the difference between random trades and intentional strategy.
🎯 Final Thoughts
Technical analysis isn't about predicting the future --- it's about stacking probabilities in your favor. By mastering the interplay between structure, zones, and momentum, you'll begin to see the market not as chaos, but as a repeating rhythm of opportunity.
And remember: zones over lines, structure over noise, clarity over clutter.

