2018 First Quarter Technical Analysis Price Forecast
As 2017 draws to a close, our analysis shows the first Quarter of 2018 should start off with a solid rally. Our researchers use our proprietary modeling and technical analysis systems to assist our members with detailed market analysis and timing triggers from expected intraday price action to a multi-month outlook.
These tools help us to keep our members informed of market trends, reversals, and big moves. Today, we are going to share some of our predictive modelings with you to show you why we believe the first three months of 2018 should continue higher.
One of our most impressive and predictive modeling systems is the Adaptive Dynamic Learning system...View it Here > https://tinyurl.com/yayvzr2e . This system allows us to ask the market what will be the highest possible outcome of recent trading activity projected into the future. It accomplishes this by identifying Genetic Price/Pattern markers in the past and recording them into a Genome Map of price activity and probable outcomes.
This way, when we ask it to show us what it thinks will be the highest probable outcome for the future, it looks into this Genome Map, finds the closest relative Genetic Price/Pattern marker and then shows us what this Genome marker predicts as the more likely outcome.
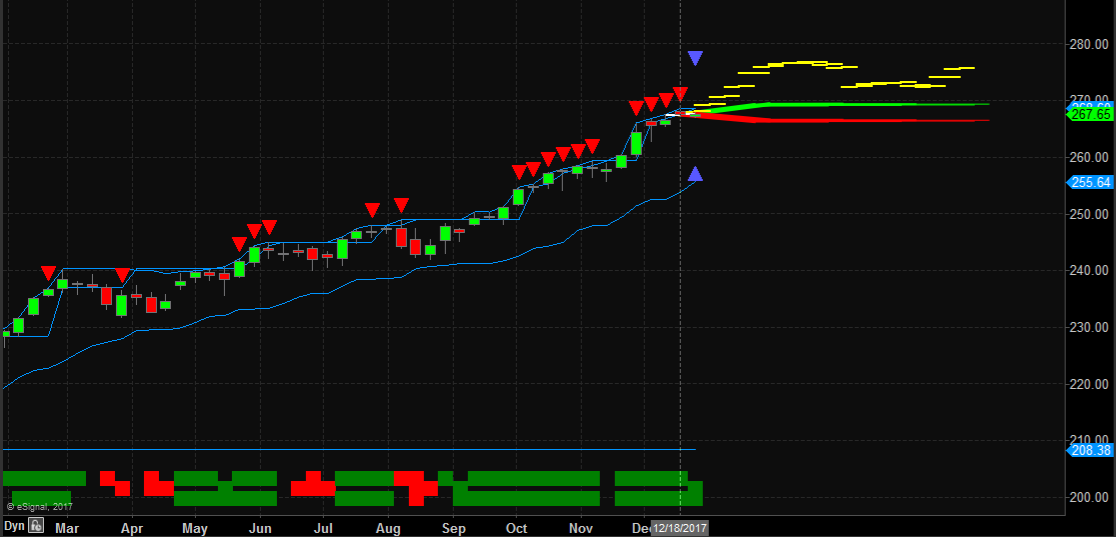
This current Weekly chart of the SPY is showing us that the next few Weeks and Months of price activity should produce a minimum of a $5 – $7 rally. This means that we could see a continued 2~5% rally in US Equities early in 2018.
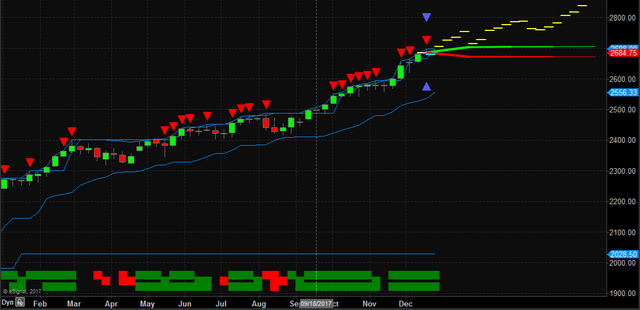
Additionally, the ES (S&P E-mini futures) is confirming this move in early 2018 with its own predictive analysis. The ADL modeling system is showing us that the ES is likely to move +100 pts from current levels before the end of the first Quarter 2018 equating to a +3.5% move (or higher). We can see from this analysis that a period of congestion or consolidation is expected near the end of January or early February 2018 – which would be a great entry opportunity.
The trends for both of these charts is strongly Bullish and the current ADL price predictions allow investors to understand the opportunities and expectations for the first three months of 2018. Imagine being able to know or understand that a predictive modeling system can assist you in making decisions regarding the next two to three months as well as assist you in planning and protecting your investments? How powerful would that technology be to you?
Our job at Technical Traders Ltd. is to assist our members in finding and executing profitable trades and to assist them in understanding market trends, reversals, and key movers. We offer a variety of analysis types within our service to support any level of a trader from novice to expert, and short term to long term investors.
Our specialized modeling systems allow us to provide one of a kind research and details that are not available anywhere else. Our team of researchers and traders are dedicated to helping us all find great success with our trading.
So, now that you know what to expect from the SPY and ES for the next few months, do you want to know what is going to happen in Gold, Silver, Bonds, FANGs, the US Dollar, Bitcoin, and more?
Join The Technical Traders to gain this insight and knowledge today....Right Here > https://tinyurl.com/yayvzr2e
Chris Vermeulen


#bitcoin
why yes bitcoin price rise, can you explain
I don't believe Bitcoin is the "long term" play in cryptos but there will be plenty of upside it in in the near term.
Hi! I am a robot. I just upvoted you! I found similar content that readers might be interested in:
http://www.thegoldandoilguy.com/2018-first-quarter-technical-analysis-price-forecast/