Point and Figure for BTC and 1 day bull div confirmed on MACD and RSI
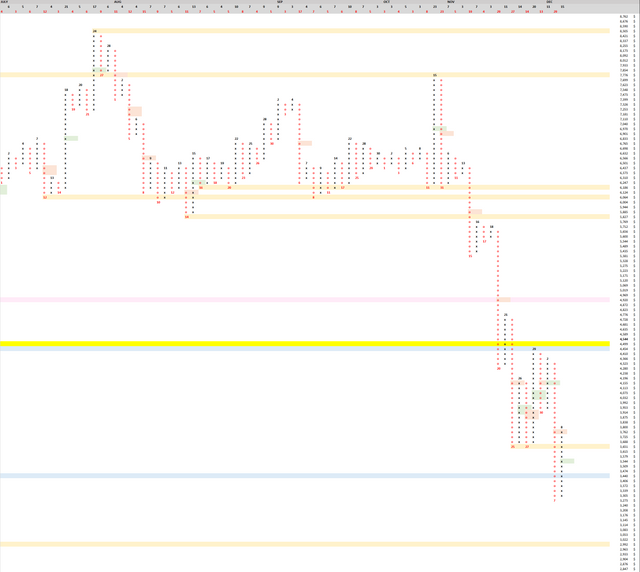
Here are the recent long pole of O's, from the big wedge breaking down, which have not resolved 50%: 10/31/2018: 23 O's, resolves if price moves above $6,901. 11/15/2018: 19 O's, resolves if price moves above $5,885. 11/20/2018: 29 O's, resolves if price moves above $4,920. It could be a while before we see all 3 resolved, but I would be cautious shorting until at least the third is resolved with a price move above $4,920.
1 day bull div confirmed on RSI and MACD  If this 1 day bull div plays out successfully, it will cascade into a 3 day bull div, which will not confirm until 3 days from now (a little more ideal if 3 day closed tomorrow but thats still ok, still bullish).
Last time I posted, I discussed what to look for during this downward price exploration following the break of the large wedge that would show that we have found a bottom (even if temporary). I recommended looking for a 3-day bull div. Having closed a 1-day bull div today was the first step towards what i've described in last post. Continue watching for the three day bull div. This is a common thing to happen, momentum indicators cascade from lower timeframes to higher timeframes.
TLDR, bulls likely to get some relief on 1 day and 3 day timeframe. Enter long here at today's close of daily to play the 1 day timeframe and hold until 3 day bull div plays out. Stop around the lower low.