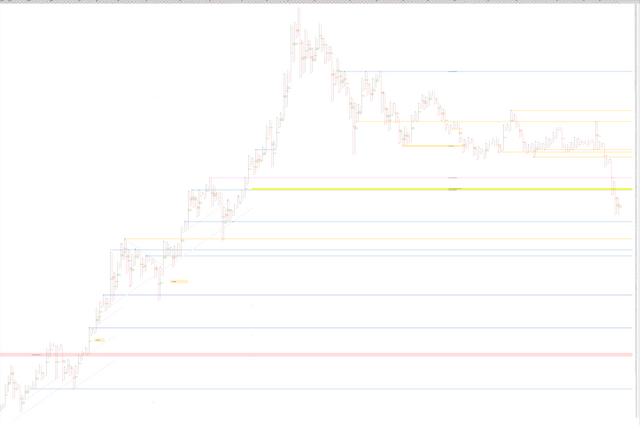
Point and Figure for Bitcoin and Analysis
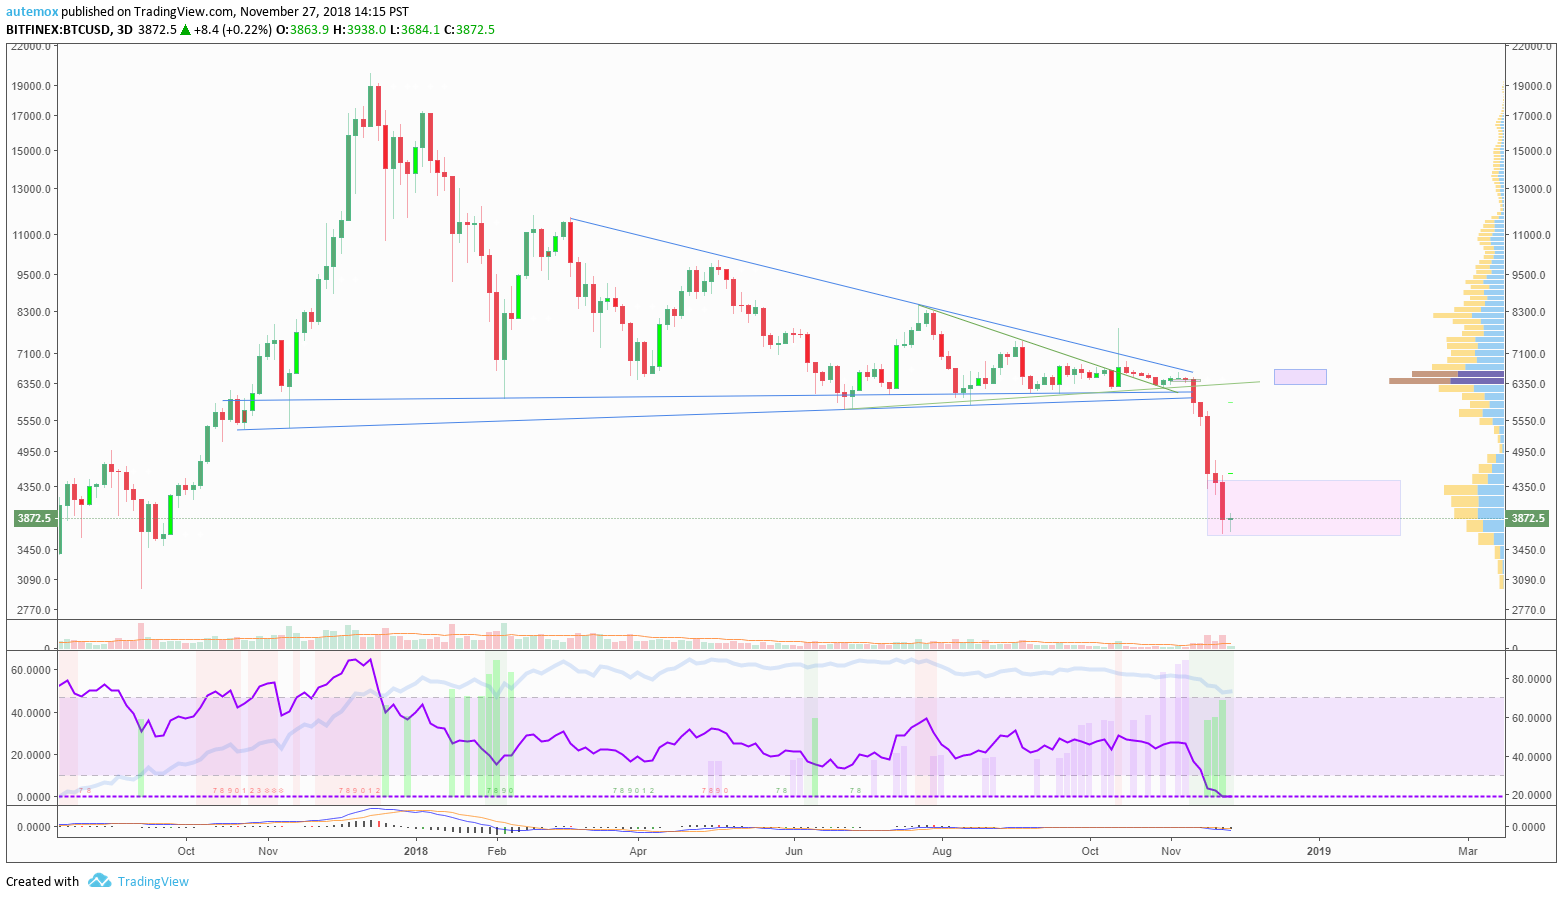
As a true believer in BTC it was sad to see it happen. I am just glad that our 3-day closed very shortly after break out from the wedge. I was committed to not shorting until the 3-day confirmed the break down (per my previous posts) and it worked out really well with timing.
Going back to the Point and Figure chart... We have 3 unresolved poles of O's, all from this month. 6,833 must be reached to retrace 50% of pole of 23 O's dating back to Oct 31. 5,827 must be reached to retrace 50% of pole of 19 O's dating back to Nov 15. 4,872 must be reached to retrace 50% of pole of 29 O's dating back to Nov 20.
Lower timeframe divergence cascade on $BTC will end with a 12 hour divergence, confirms in 1 hour:  I would like to see a bull div on 3-day or weekly before long term longs are opened, but this could be a signal to close your short or do a short term long (maybe close it at the top of my pink range, which is based on horizontal levels and volume profile). I don't usually see divergence across RSI, macd, macd histogram, and accumulation/distribution all at once... but it doesn't really matter much... I mostly only watch RSI and keep the others small at bottom of my chart.