Point and Figure and discussion on how high this daily bull trend can go before there is a shorting opportunity
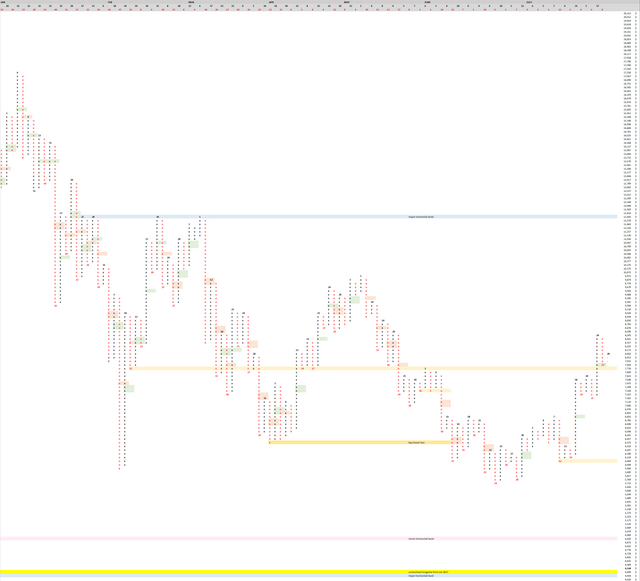
FIB Interactions  We found resistance at 62% local FIB and more recently found support at the 50% FIB and the point of higher high/breakout from 6/3 high. This doesn't tell us a lot- boucing between FIBs would happen regardless if you are bullish or bearish. So lets take a look at our trendline here: The thick green trendline has been broken and we closed above it on 7/24. This is very bullish.
So where is major resistance? I've been preaching about shorting somewhere between local 62% FIB (8,450) and major 23% FIB (9,000) for a while now, and I will stick to that. We've reached the first area but the risk:reward was not great enough to enter a short. I believe we will move up to 9,000 and fail somewhere before making a higher high against 05/04 (9,920). Stop loss would be set at a break of 10k.