Inline Profiling for Linux
A couple of months ago, I wrote an inline profiling tool for linux called ThreadTracer.
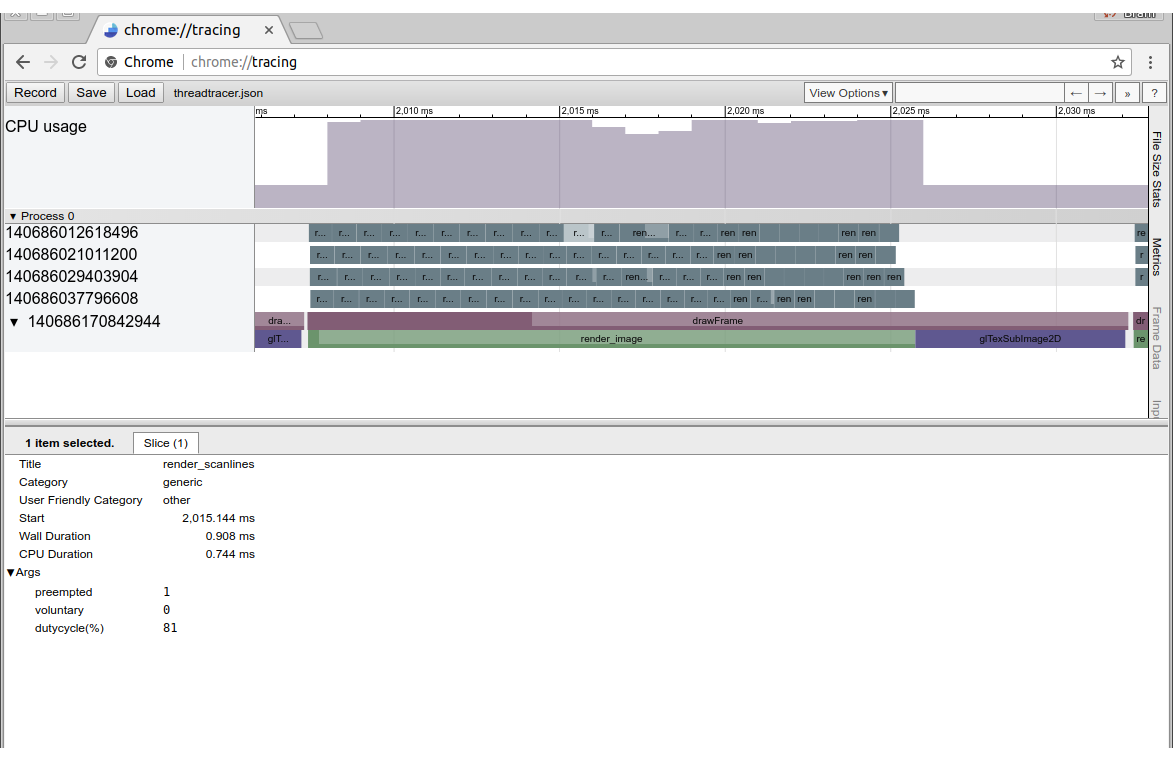
The existing solutions for Open Sourced Inline Profiling were kind of limited. I needed a profiler that would not just show how long the sections of code took, but also, for how long they were actually scheduled to run on a CPU core.
ThreadTracer can show you which tasks are running on your threads, but also shows you if the thread was swapped out. It will even tell you how often it got preempted involuntarily, and how often it yielded the CPU voluntarily.
The tool is Linux only, but very lightweight. It comprises just a single C file and a single C header file. The profiling adds very little overhead to the code, and is careful never to put your thread to sleep by doing an operation that could block.
If you run your program with profiling enabled, it will create a trace file that can be visualised with the Chrome browser.
So take it for a spin, and let me know what you think of it. Better yet, send me one of your traces, as I am always curious to see profile data.
Integrating the profiler into your codebase is just by a few lines of code, and adding a single C file to your project.
#include <threadtracer.h>

// Each thread that will be generating profiling events needs to be made known to the system.
// If you sign in with threadid -1, the threadid of calling thread will be used.

tt_signin( -1, "mainthread" );

// C Programs need to wrap sections of code with a begin and end macro.

TT_BEGIN( "simulation" );
simulate( dt );
TT_END( "simulation" );

// C++ can also use a scoped tag. Event automatically ends when it goes out of scope.
void draw_all(void)
{
    TT_SCOPE( "draw" );
    draw_world();
    if ( !overlay )
        return;
    draw_info();
}

// When you are done profiling, typically at program end, or earlier, you can generate the profile report.

tt_report( "threadtracer.json" );

Great tool, this could be useful to benchmark deploy code :D! And at work (and our client) we use Jira (for ticketing), and sometimes, because of a damn query run on the entire Jira log, it clogs the entire machine (and start looking for the wild thread...).
Congratulations @mazarax! You have completed some achievement on Steemit and have been rewarded with new badge(s) :
Click on any badge to view your own Board of Honor on SteemitBoard.
For more information about SteemitBoard, click here
If you no longer want to receive notifications, reply to this comment with the word
STOP