US Stocks - 1987 pattern - Gap Down, Surge Up, Break Down
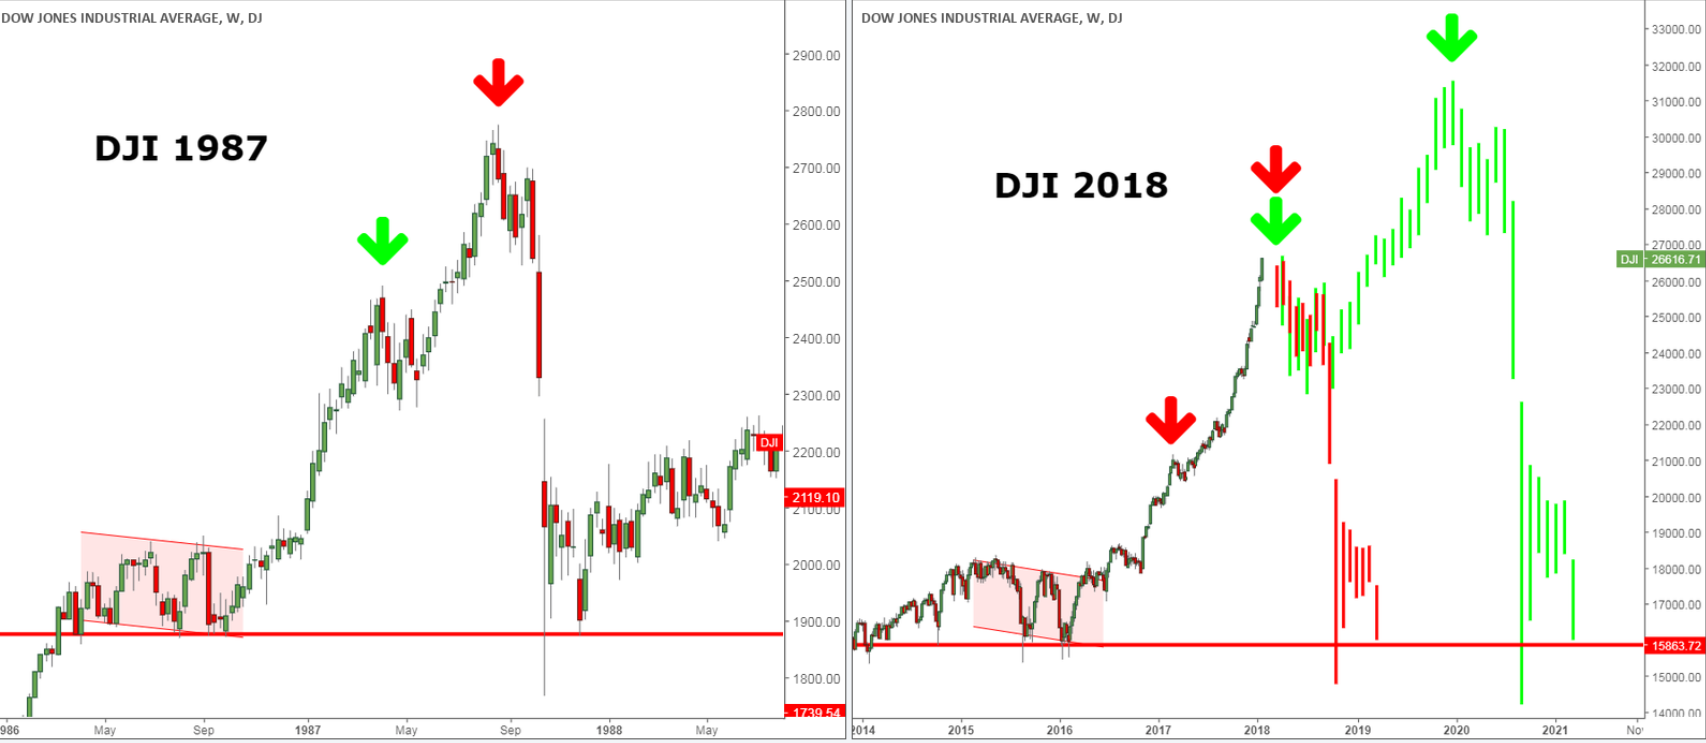
Let’s start with a chart that shows my 2 main scenarios for the DJI: green and red.
The green scenario assumes a correction of 10% followed by another parabolic surge up. The red scenario assumes we’re at the start of the famous 1987 crash.
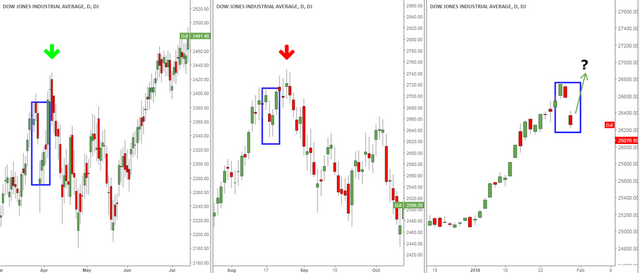
Whether it’s the green or red scenario that plays out, they both have something in common that is very interesting to share and it might provide a road map for the next couple of days, see 2nd chart below.
In both scenarios (red or green) we see the DJI gapping down at the open (blue box) after which a surge up to new highs unfolded.
In today’s market, we see the same: the DJI is gapping down. If these patterns repeat, then a DJI of 27.000 could be next.
I closed some of my short positions in anticipation of this final surge up. I also took a small long position to play this final surge up. I will load up on short positions & put spreads if the DJI fits the pattern I just described.
For daily updates on the markets: check out this page:
http://tripstrading.com/bitcoin-daily-chart/
https://steemit.com/trading/@damien197/dow-j-sp500-4h-d1-w1-analysis
https://steemit.com/stock/@damien197/usa-stock-market-buble-and-the-madness-of-central-banks-debt-leverage
something hangs in the air with a bigger correction on the stock market
Thanks for sharing! I think so too...either this year we'll see a re-run of the 1987 crash or it will be next year (GANN Panic Cycle).