A visual update on burning activity
It's been quite some time since I posted the burning statistics.
TBH, it's a time consuming and boring exercise to produce, copy, and paste the relevant graphs (especially when steemdb.io is having availability challenges - which is fairly common), and it felt like people were losing interest, so I just stopped going through the effort. But @wilmer1988 asked for an update a short time ago, so I thought I'd post one today.
It might also be interesting to record the current baseline, since there has been a recent uptick in burning-related activities.
|
|---|
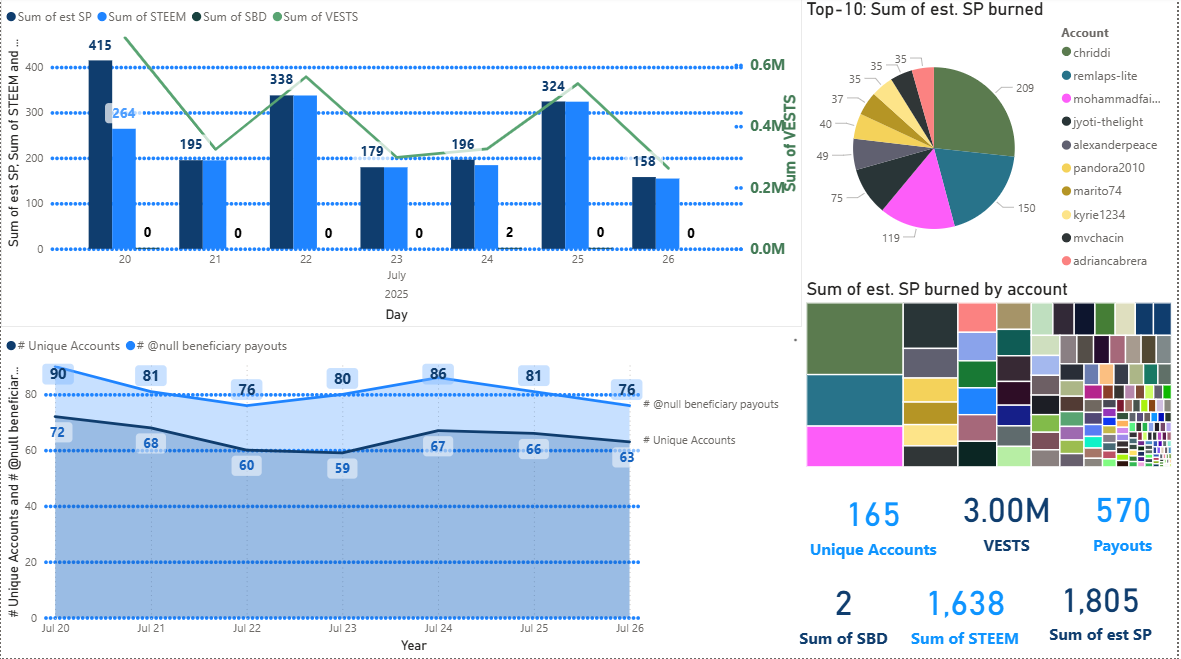
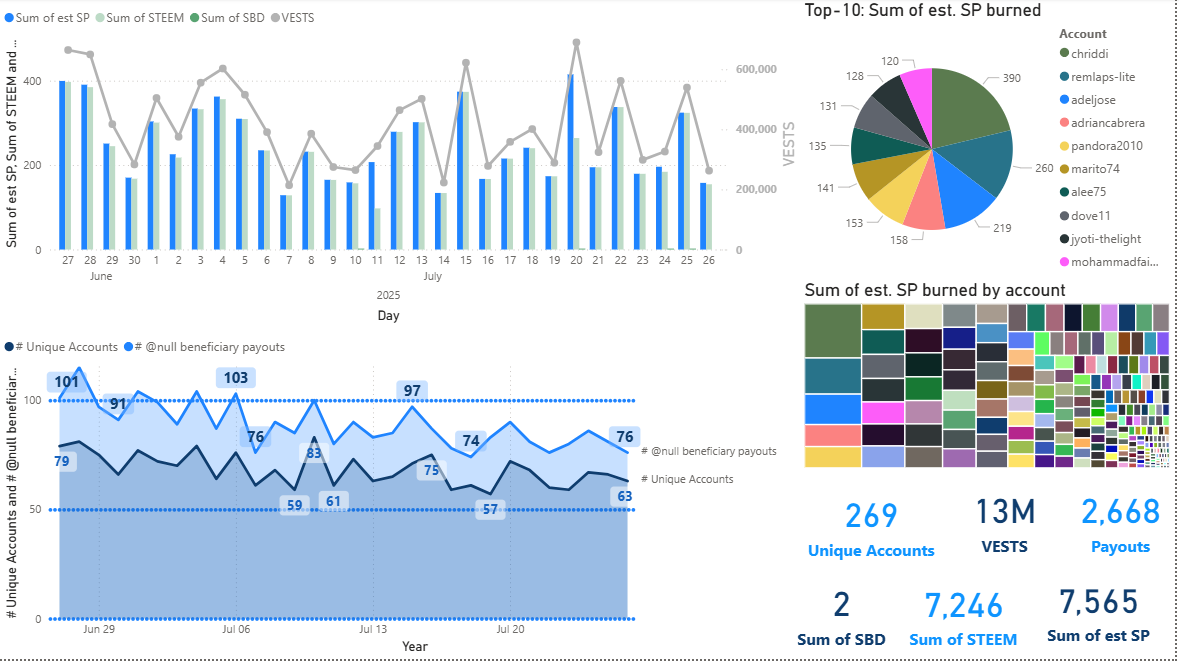
Beneficiary Burning by account - straight from the blockchain
Weekly graph
Monthly Graph
Burnsteem25 era
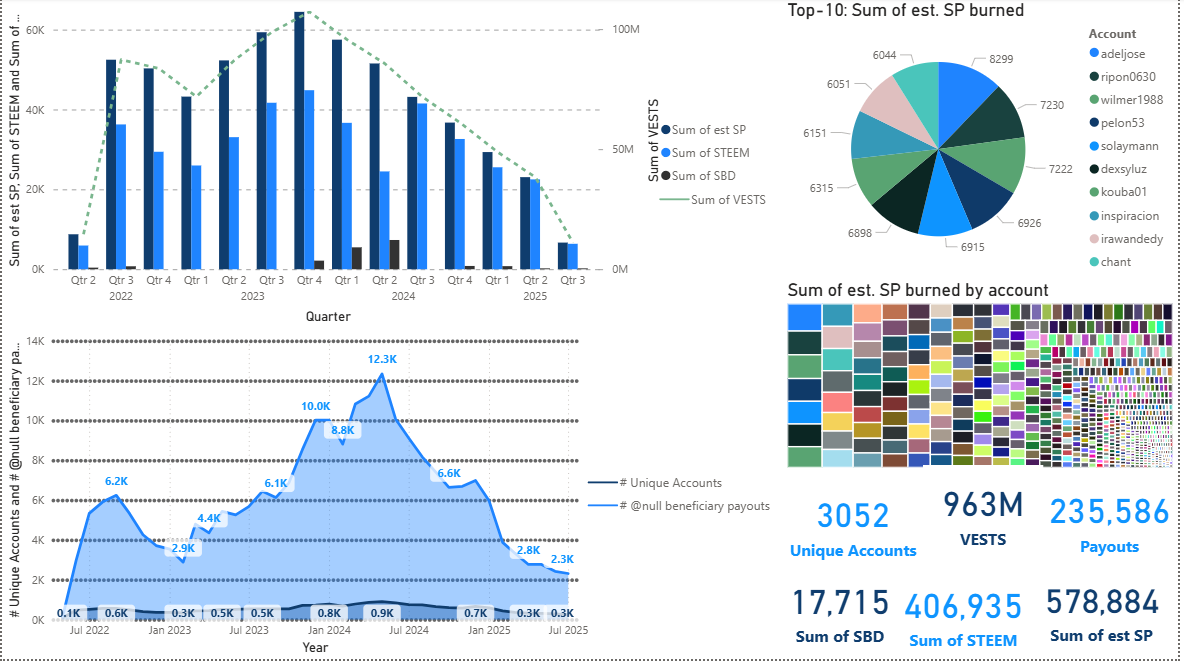
- If you add SP, STEEM, and SBDs, that's almost certainly more than a million STEEM total.
All time
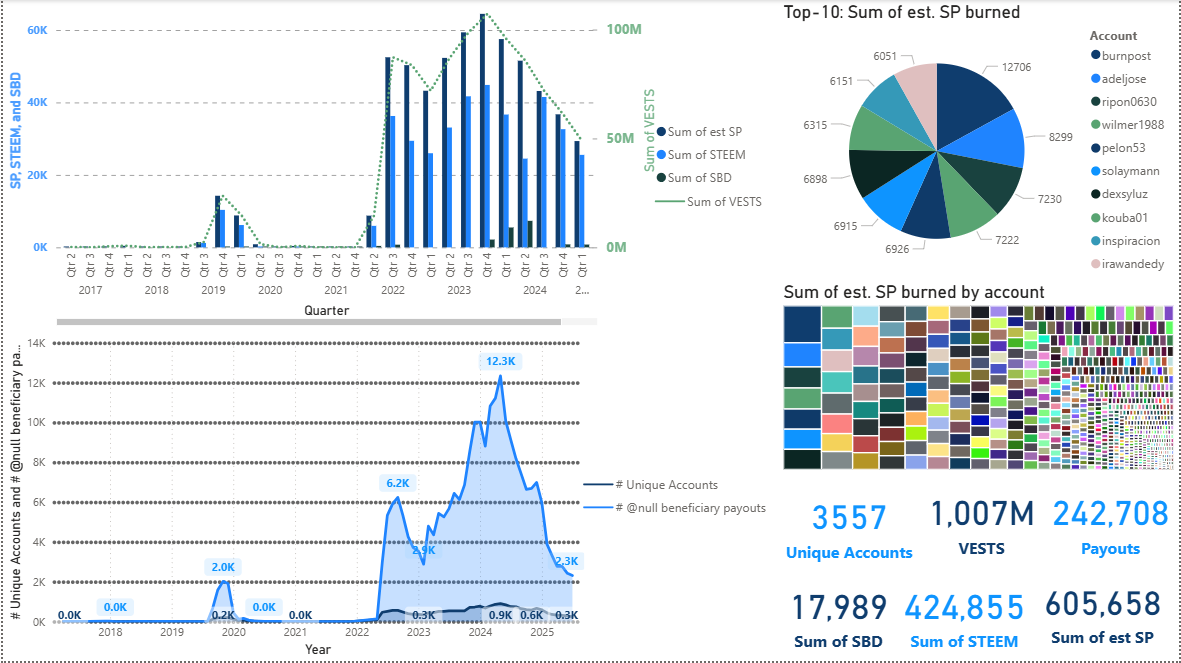
- One thing that jumps out at me here is that "burnpost" doesn't stand out the way it used to among the top-10 accounts.
- Another thing that jumps out at me is the way that the totals in the burnsteem25 era dwarf the totals in the 2019/20 burnpost era.
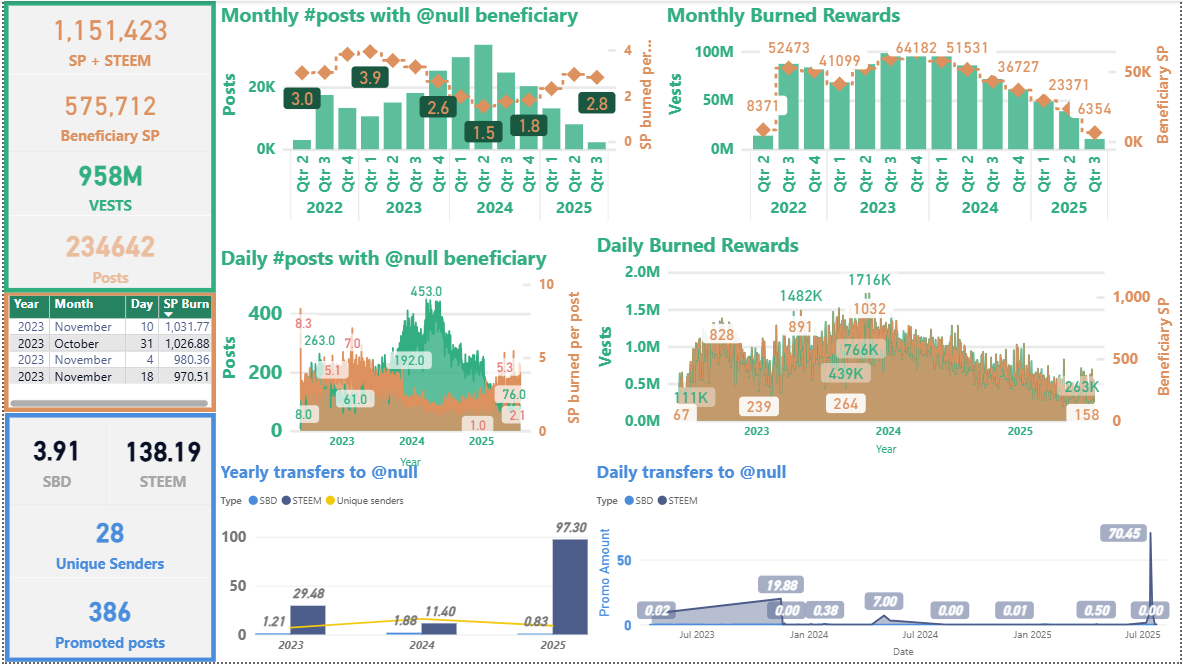
Overall burning activity - from SteemDB
- Reminder that this set of graphs does not properly account for 100% SP posts. The total is estimated by doubling the SP amount, which overestimates the value when 100% SP is used by an author.
90 day averages
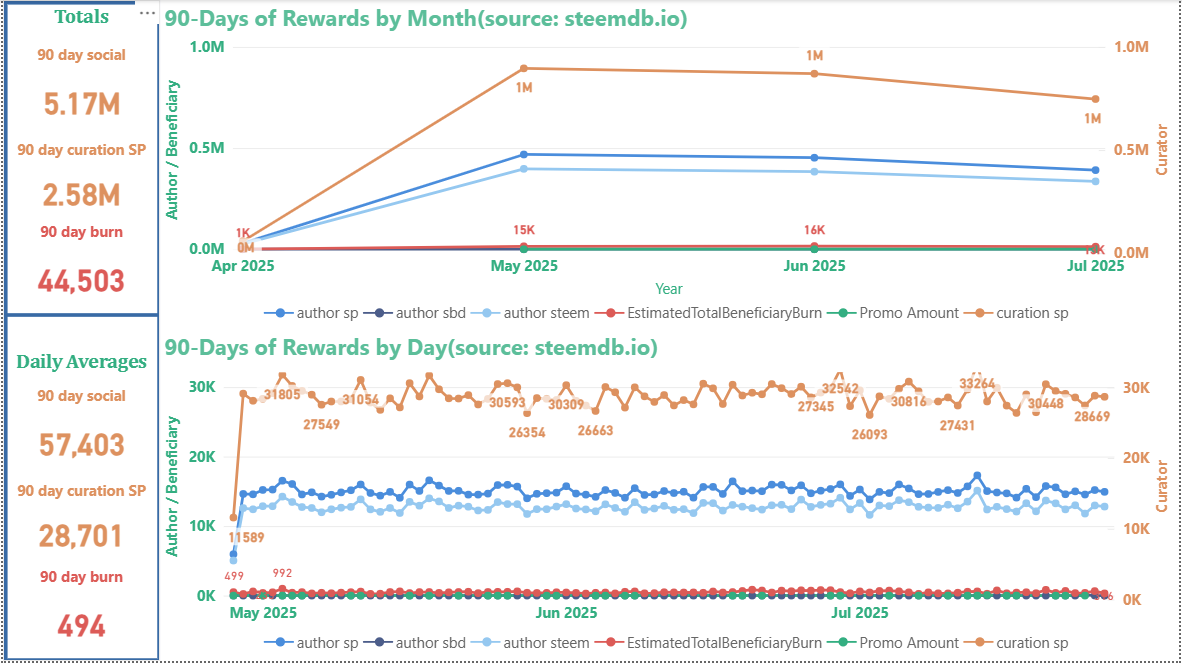
- So, we're averaging a bit under 500 STEEM/SP burned per day during the last 90 days (compared to ~1148 back in 2023).
Weekly burning overview
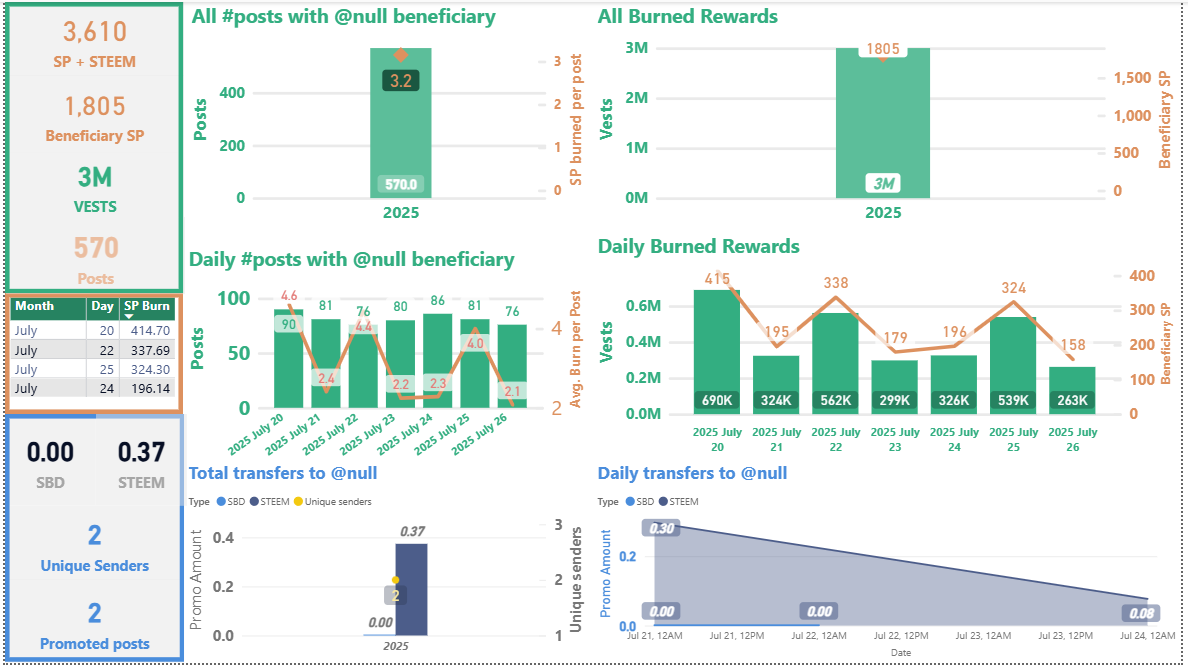
Overview with all available info from SteemDB
- Note that the July 14 spike to ~70 STEEM in the bottom-right visual is mostly credited to the
gentbgaccount.
Unrelated
Inflation update - all available data
As long as I updated the info from SteemDB, let's also take a quick look at inflation and SBD conversions, too.
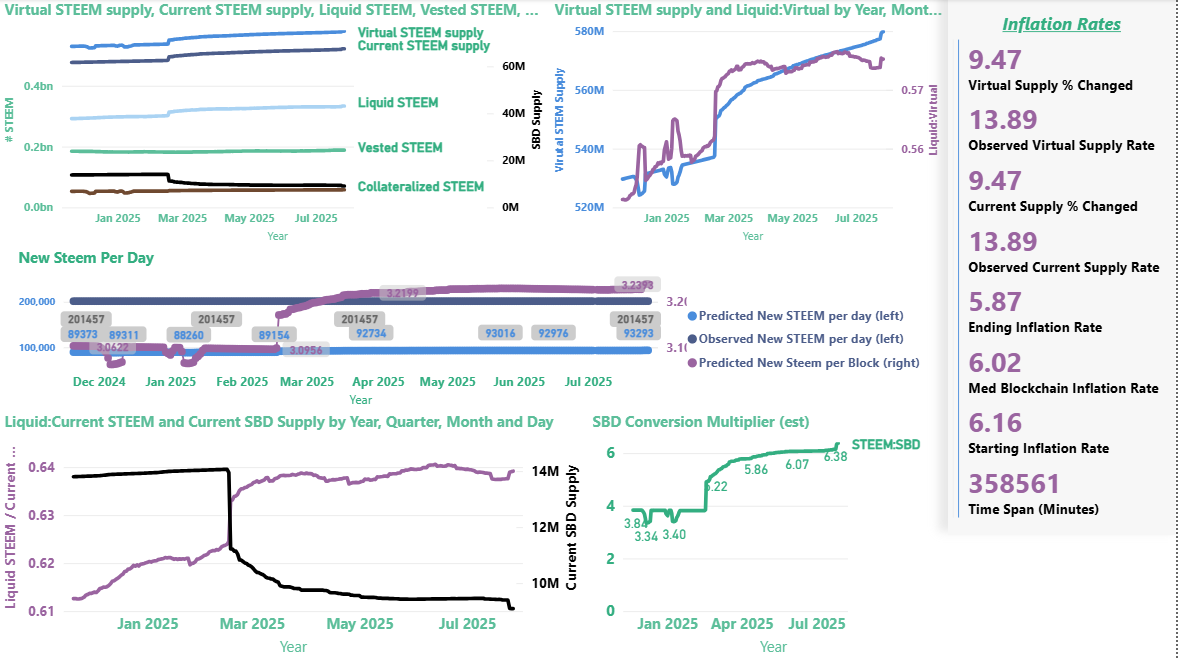
Inflation update - 30 days
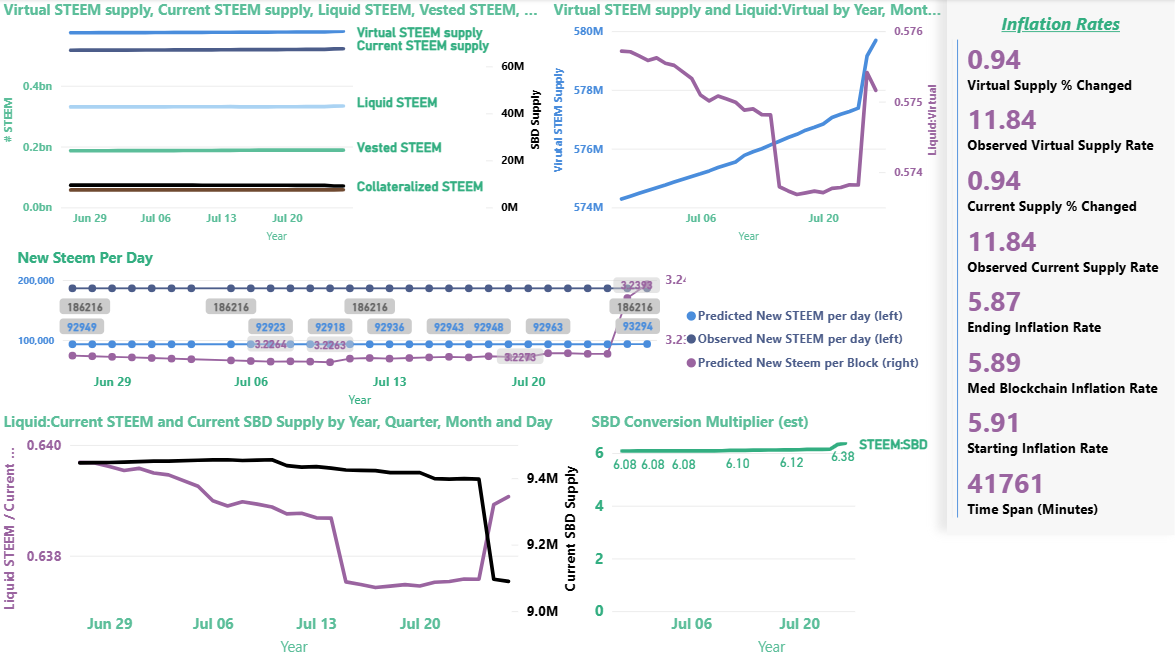
- In the last 30 days, inflation jumped up to almost 12% again, which doubles the blockchain's scheduled inflation rate. Why?
SBD Conversions
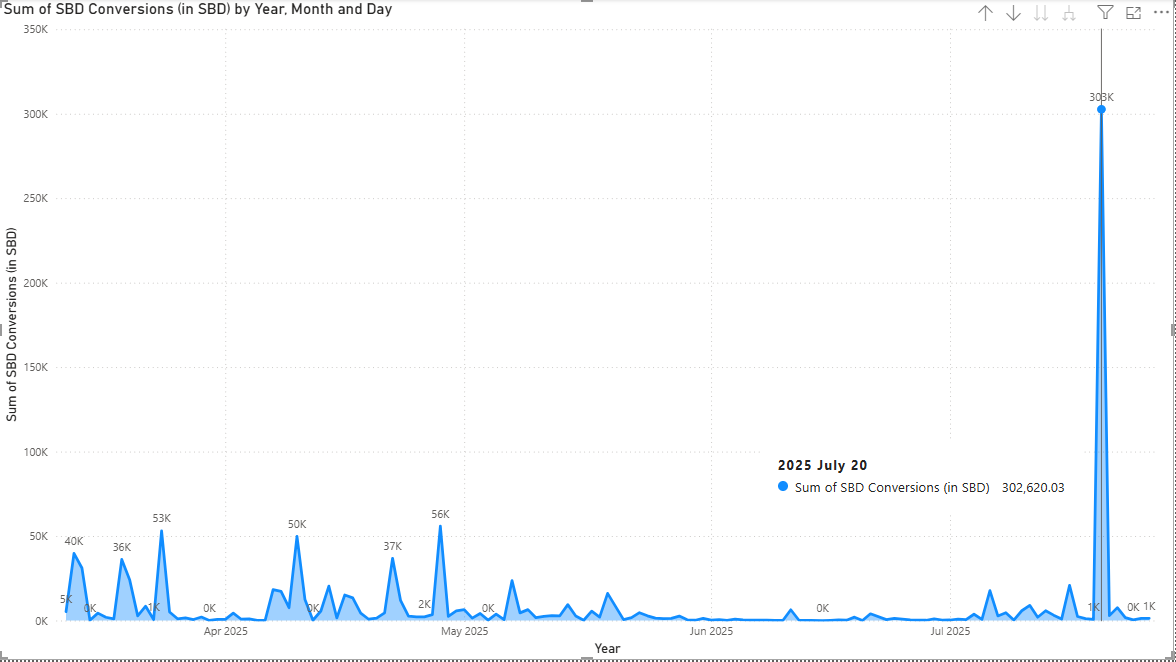
- Because a large volume of SBD conversion activity on July 20 increased the number of STEEM per SBD from 6.12 to 6.38, which increased the virtual supply by about 2.3 million STEEM.
Commentary
If we want to offset the inflation from SBD conversions, I'm only aware of two possibilities:
- Burning tokens via beneficiary rewards or null transfers; or
- Raising the price of STEEM above the haircut threshold (which will shrink the virtual supply by reducing the number of STEEM paid per SBD)
As we've seen in the past, the inflation reduction (and even deflation) that can be accomplished when the STEEM price rises far exceeds what we have thus far managed to accomplish by burning.
On a positive note, with almost 57% of all SBDs now held by the SPS, there are practical limits as to to how much conversion activity can continue.
Discussion Question: In the spirit of, You get what you measure, is the decline in burning activity that began after Q4/2023 related to the fact that I stopped publishing this weekly series in September of that year - or is that timing just a coincidence?
Do you have an idea why did liquid virtual STEEM decline around July 13?
I can't remember a particular event? I'm guessing there were more powerups since your charts don't show burn with this sums.
The temporary partial printing of SBD on July 24 obviously had no significant impact on the numbers, or is the data from that day not yet included?
No doubt ;-) I have missed your Reports several times. Doing it myself is not an option. Nobody can do it as clearly as you.
I hadn't noticed the drop in liquid STEEM, but I just checked SteemWorld. One account powered-up about 600k in STEEM on July 14, so I guess that's the reason.
July 24 should be in the data, but I don't think it lasted long enough to be visible. SteemDB normally only updates every 8-12 hours.
chriddi, moecki and/or the-gorilla
Hello @remlaps-lite! 👋
Congratulations! This post has been upvoted through @steemcurator05. We support quality posts, good comments anywhere, and any tags.
Curated by: mohammadfaisal
https://steemit.com/steemit/@sithukyawdoller/preit-gyi-11-introduction-to-the-preiktao-natpint
@remlaps-lite, thanks for braving the SteemDB gremlins and posting these burning statistics! It's seriously appreciated – these numbers are crucial for understanding the Steem economy's health. I'm constantly referring back to your previous analyses.
The visual breakdown really highlights the impact of the
burnsteem25era. It's fascinating (and a little concerning) to see the recent inflation uptick and the role SBD conversions play. Your commentary on offsetting inflation through burning or price increases is spot on. And that's a very good point about the SPS holding so much SBD now!As for your discussion question: I definitely think that discontinuing the series and reduced burning are related. Visibility and metrics play a huge role, especially when the community sees you making an effort to track the data. Thanks for bringing this back to light! I'm definitely going to spread this around.