Application of Geophysics and Geostatistics for the detection of water in the subsoil
Geophysics has been applied for decades to the detection of hydrocarbons and minerals in the subsoil through the exploration and application of different methods to detect minerals or changes (phenomena) present at different depths through interpretations or using software such as Surfer, Petrel , IPI2Win, SGems among many others that exist that help to identify the strata in the subsoil and the interpretation of what happens in it.
For years the different technological advances have led to seek new exploration techniques that are more effective in less time and with lower expenses, for which statistics began to form a fundamental part of the study of sub-soil making interpretations and estimates of data through of previous studies made from surface without the need to drill large holes or damage the environment.
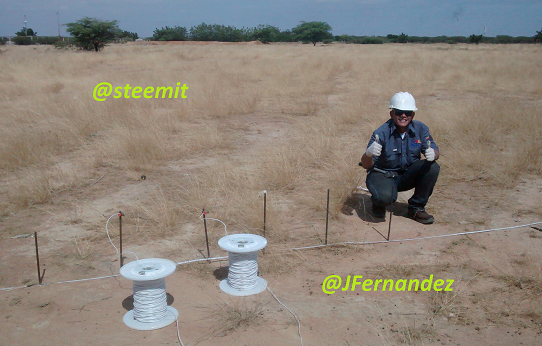
Initially the data must be obtained, the easiest way to do it is through a georesistivimeter by means of which an electrical impulse is provided in the ground that travels long distances detecting all the interruptions that are found, these impulses are supplied through of emitting electrodes and collected by receiving electrodes having a distribution according to the method as shown in Image No. 2.
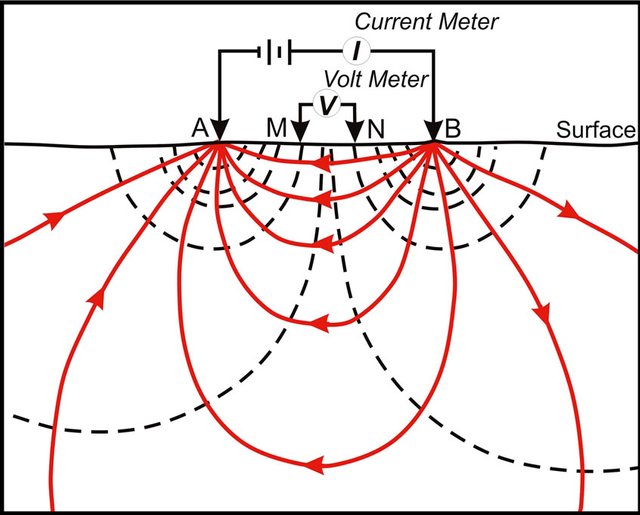
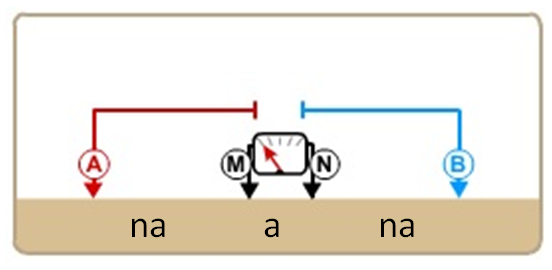
The electrodes are connected with the georesistivímetro through a series of cables that allow to induce the current in the terrain and receive the potential deferenciales so that through a particular method the mathematical calculations to be used in this way can be determined to obtain the value of the apparent resistivity of the terrain. One of the methods used is the Wernner-Schlumberger Method and the distribution of image No. 3 and Formula No. 1 is used to obtain the resistivity of the ground.
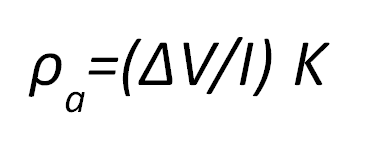
ρa: Apparent soil resistivity.
I: Current supplied to the external electrodes.
∆V: Difference of electric potential received in electrodes M and N.
K: Penetration factor or device coefficient.
For the determination of the penetration factor or coefficient of the device (K), the expression of formula No. 2 was used.

a: Existing distance in meters between the M and N receiver electrodes.
na: Distance of separation in meters between the M or N receiving electrode to the current emitting electrode A or B.
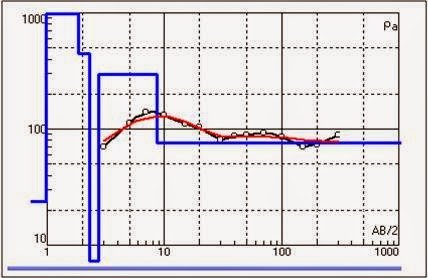
The electrodes must be inserted well in the ground and take all the necessary data according to the chosen method to have an interpretation according to the reality of the terrain and establish how many layers of the subsoil were detected with the test, in this way obtain interpretations as shown in Image No. 4, which will explain how to make them in other future publications.
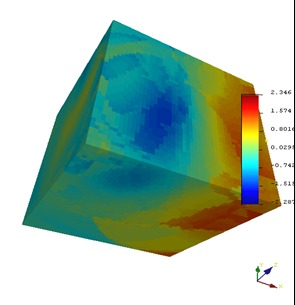
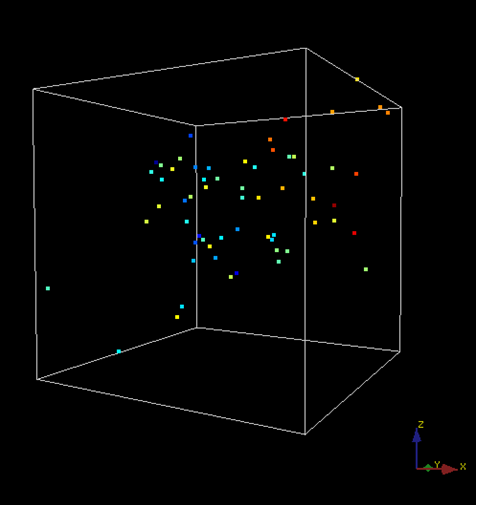
After the data collection, there are values separated from each other by the terrain, leaving space in the terrain without having any knowledge of its geological or structural environment that can be seen as in Figure N ° 5 when they are plotted in 3D:
Therefore, to save time, effort and money, geostatistics is applied, which allows estimating data values in places where information is not available through data obtained on the surface, extrapolating information by means of empirical methods and estimation already established as the Kriging or Co-Kriging according to the amount of variables present in the study.
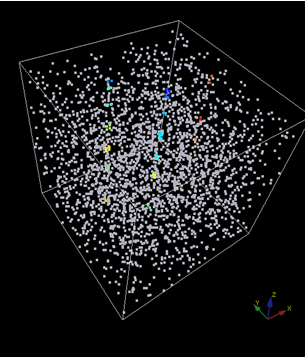
Once the estimations are obtained, gestational interpretations of the behavior of the water in the land are obtained starting from the apparent resistivities of the water in function to the resistivity of the land and the distribution of this in the environment as shown in the image N ° 7.
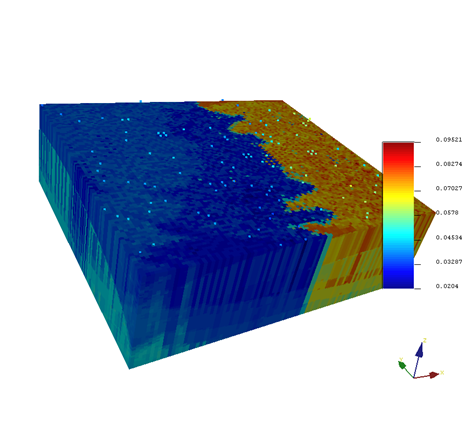
Where between more blue the water is purer and sweeter and between more red it is brackish water with high conductivities.
To establish the mobility of water in the subsoil, different software can be used to treat the data and integrate them into a set of simulations that help identify the environment and its future projections as identified in Image No. 8.
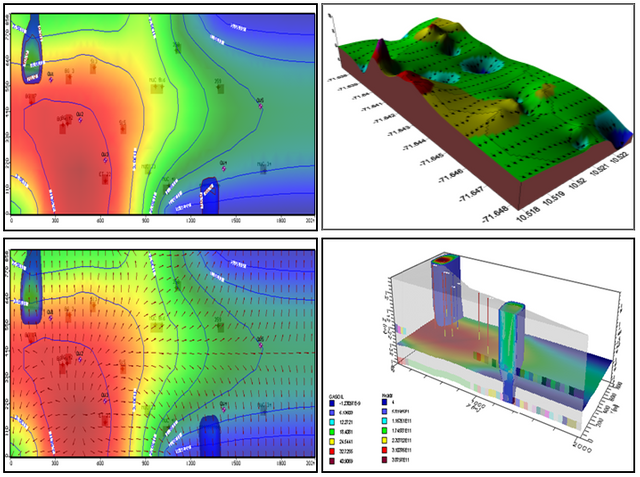
Having as results simulations of the behavior of the water environment of the aquifers present in any area that is carried out the study through applications and geophysical and geostatistical methods with use of time, effort and investment.

