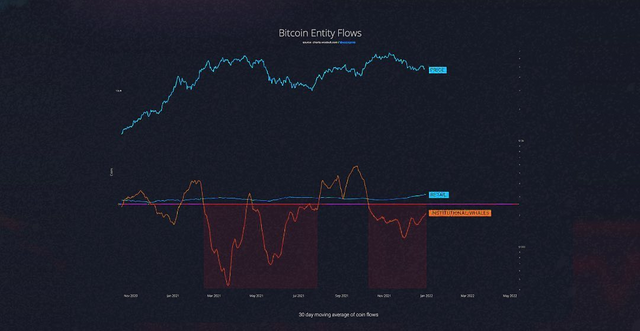
Check the 30-day chart of net bitcoin flows
As the chart shows, retail sales in 2021 look stronger than ever. In fact, institutions and wallets were more inclined to buy from August to September, and more inclined to sell from November to December. They are now moving to the shopping area in January 2022.
Net flow chart:
🟠 Orange = Holders of more than 1000 bitcoins
🔵 Blue = Holders of less than one bitcoin