SEC || S20W2 || Data Analysis With Google Sheets: (Advanced Excel Formulas, And Pivot Tables)

source
Hello, my country people!!
It feels so good to join in this great learning opportunity, and of course, learning is for everyone who understands that it never ends. I have followed by, and it has been quite interesting, so I want to contribute to the fun of learning.
Explain What You Understand By Advanced Excel Formulas, And Show Us Where Advanced Formulas Such As The Lookup Function, And Logical Function Are Found In Excel With Clear Screenshots |
|---|
Just as the name implies, advanced Excel formulas basically delineate the functions or commands that can be applied to assist in accurately solving complex or advanced mathematical problems within a very short space of time, which, wontedly, would take longer to sort and solve.
Complex mathematical tasks such as report creation, summation, data analytics, probability, arithmetic calculations, dashboard creation, and other statistical exponents are all composed in it for the quicker and easier mathematical study of functions, sequences, series, limits, derivatives, and integrals.
Mathematical tasks and analytics have been made much easier, less stressful, and more time-consuming by just understanding how to utilize these functions. Excel comes with these advanced functions, and they can be used singly or in combination with other functions to execute tasks or spawn faster solutions.
The TEXTJOIN, SUMIF, INDEX, ARRAY, LOOKUP, WORKIF, etc are some of the advanced formulas or functions found in the Excel worksheet
How we can find the Lookup and Logical functions:
The procedure definitely varies for mobile and computer systems. In this publication, I will be explaining the steps using my mobile phone.
- First I launch the Excel sheet and click on a cell (A19) to display the function icon "fx" at the bottom left corner beside the text bar
- Click on the function icon to display the available functions
- Select the Lookup or Logical functions


 Logical Function
 Lookup Function
Write the IF Function Formula To Calculate The Total, Average Score, And Grade Of Students Given In The Table Below. |
|---|
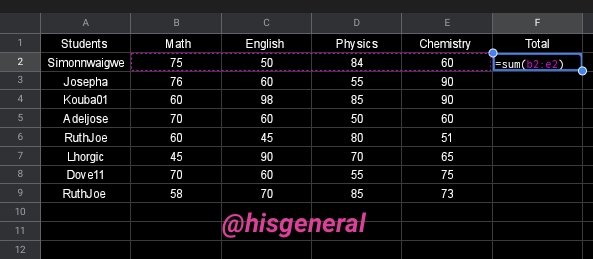
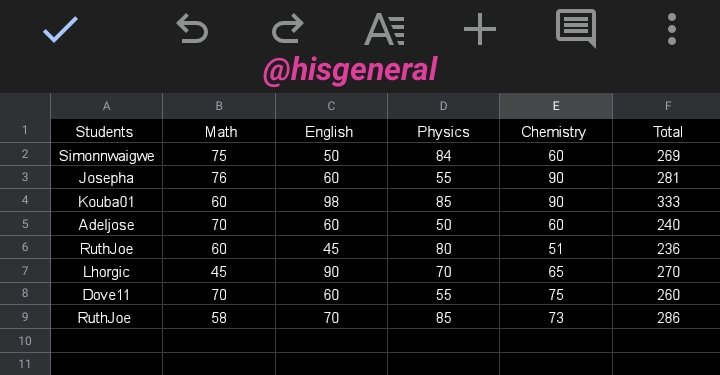
Summation of Total:
To calculate the total, I simply the command =SUM(B2:E2) indicating the values from cell B2 to cell E2. This gave the total of 296 for Simonnwaigwe. The same was done for all the listed students in the list in their respective cells.
Average:
For this, I simply go to the cell for average and input the command =AVERAGE(B3:E3) for Simonnwaigwe and got his average of 67.25.
The same was done for all the students and the average is shown below.


Grade:
To get the student's grade, the "IF" command is used. The command is as follows: =IF(G2>=70,"A",IF(G2>=60,"B",IF(G2>=50,"C",IF(G2>=40,"D",IF(G2>=30,"E,"F"))))) for the student on row 2.
Hence the grade for Simonnwaigwe is "B" as indicated below


Briefly Discuss Four IF Function Operators That You Have Learned And Tell Us Their Functions And When We Are To Use Them. |
|---|
There are primarily four categories of IFs as well as their applications.
- For the IF equality command, we have the following <, <=, >, >=, =, ><
- For IF logical operations there are AND, NOT, and OR
- IF error and
- IF for multiple conditions
Based On The Given Data Below: Create A Pivot Table That Shows (see) Total Sales By Product, By Dragging Product To The Rows Areas, Region To The Column Area, And Sales To The Values Area. Please We Want To See The Steps You Take In Adding Your Pivot Table. |
|---|
- Step 1:
I. I launched my mobile phone spreadsheet and inputted the given information.
II. After inputting the required information, the next was to highlight them.
III. I clicked on the menu icon at the tool bar.

- Step 2:
I. I selected Insert from the menu list
II. Another dialogue box opened, from which I selected Pivot Table and clicked Done on the next interface.


- Step 3:
I. Here, I added my column, row, and data fields as I wished to have my information.
II. Next was to click on Export and this had the Pivot Table done and dusted.


The lesson was quite interesting, but doing the presentation was something else; nevertheless, it was refreshing, educational, and impactful. The use of spreadsheets is interesting and a bit professional.
@ninapenda, @chilaw, and @chima09 are invited to join the contest.