STEEM: Bullish or Bearish???
Hello guys... welcome back...
In the previuos weeks the spread steem/btc collapsed @0.001 (new low). What happend?...
we don't want to justify this trend using ftundamental or news analysis but only technical...
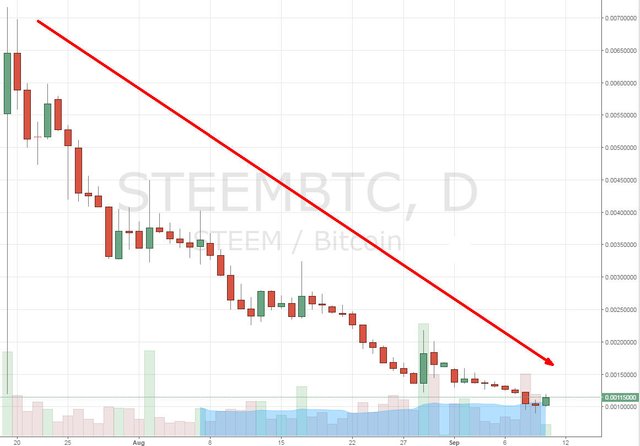
Look at the long-term chart (daily timeframe):
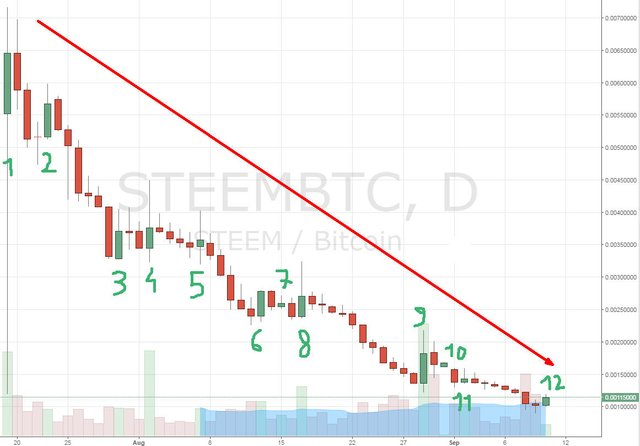
This chart is composed by 54 candlestick, from 2016/07/19 to today... How many candles are positive?...
Only 12, or in other terms 22% of the total...
In technical analysis it's possible to built an indicator to check the number of bullish/bearish candles. It's very interesting and useful. This kind of indicator is based on a simple idea: bullish market (bearish market) is composed by greater number of bullish candles (bearish candles)...
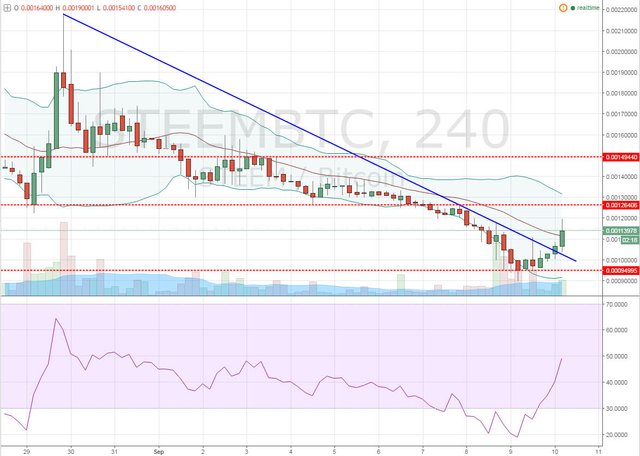
Now look at the intraday chart (4h timeframe)...
We're in a bullish trend (trendline's breakout) and the targets are:
1st @0.126
snd @0.149
The RSI oscillator supports this rebound. This scenario is applied if prices don't drop below @0.0094.
We'll update tomorrow...
Best
P.S. For any questions, reply!!!


It's a bull now! Look at the 20% increase since then!
Correct!... It's bullish in the short-term
quant01 upvoted and followed . You also may find my work interesting @me-tarzan
Tnx!!!!! Done