Crypto trading January 10, 2018
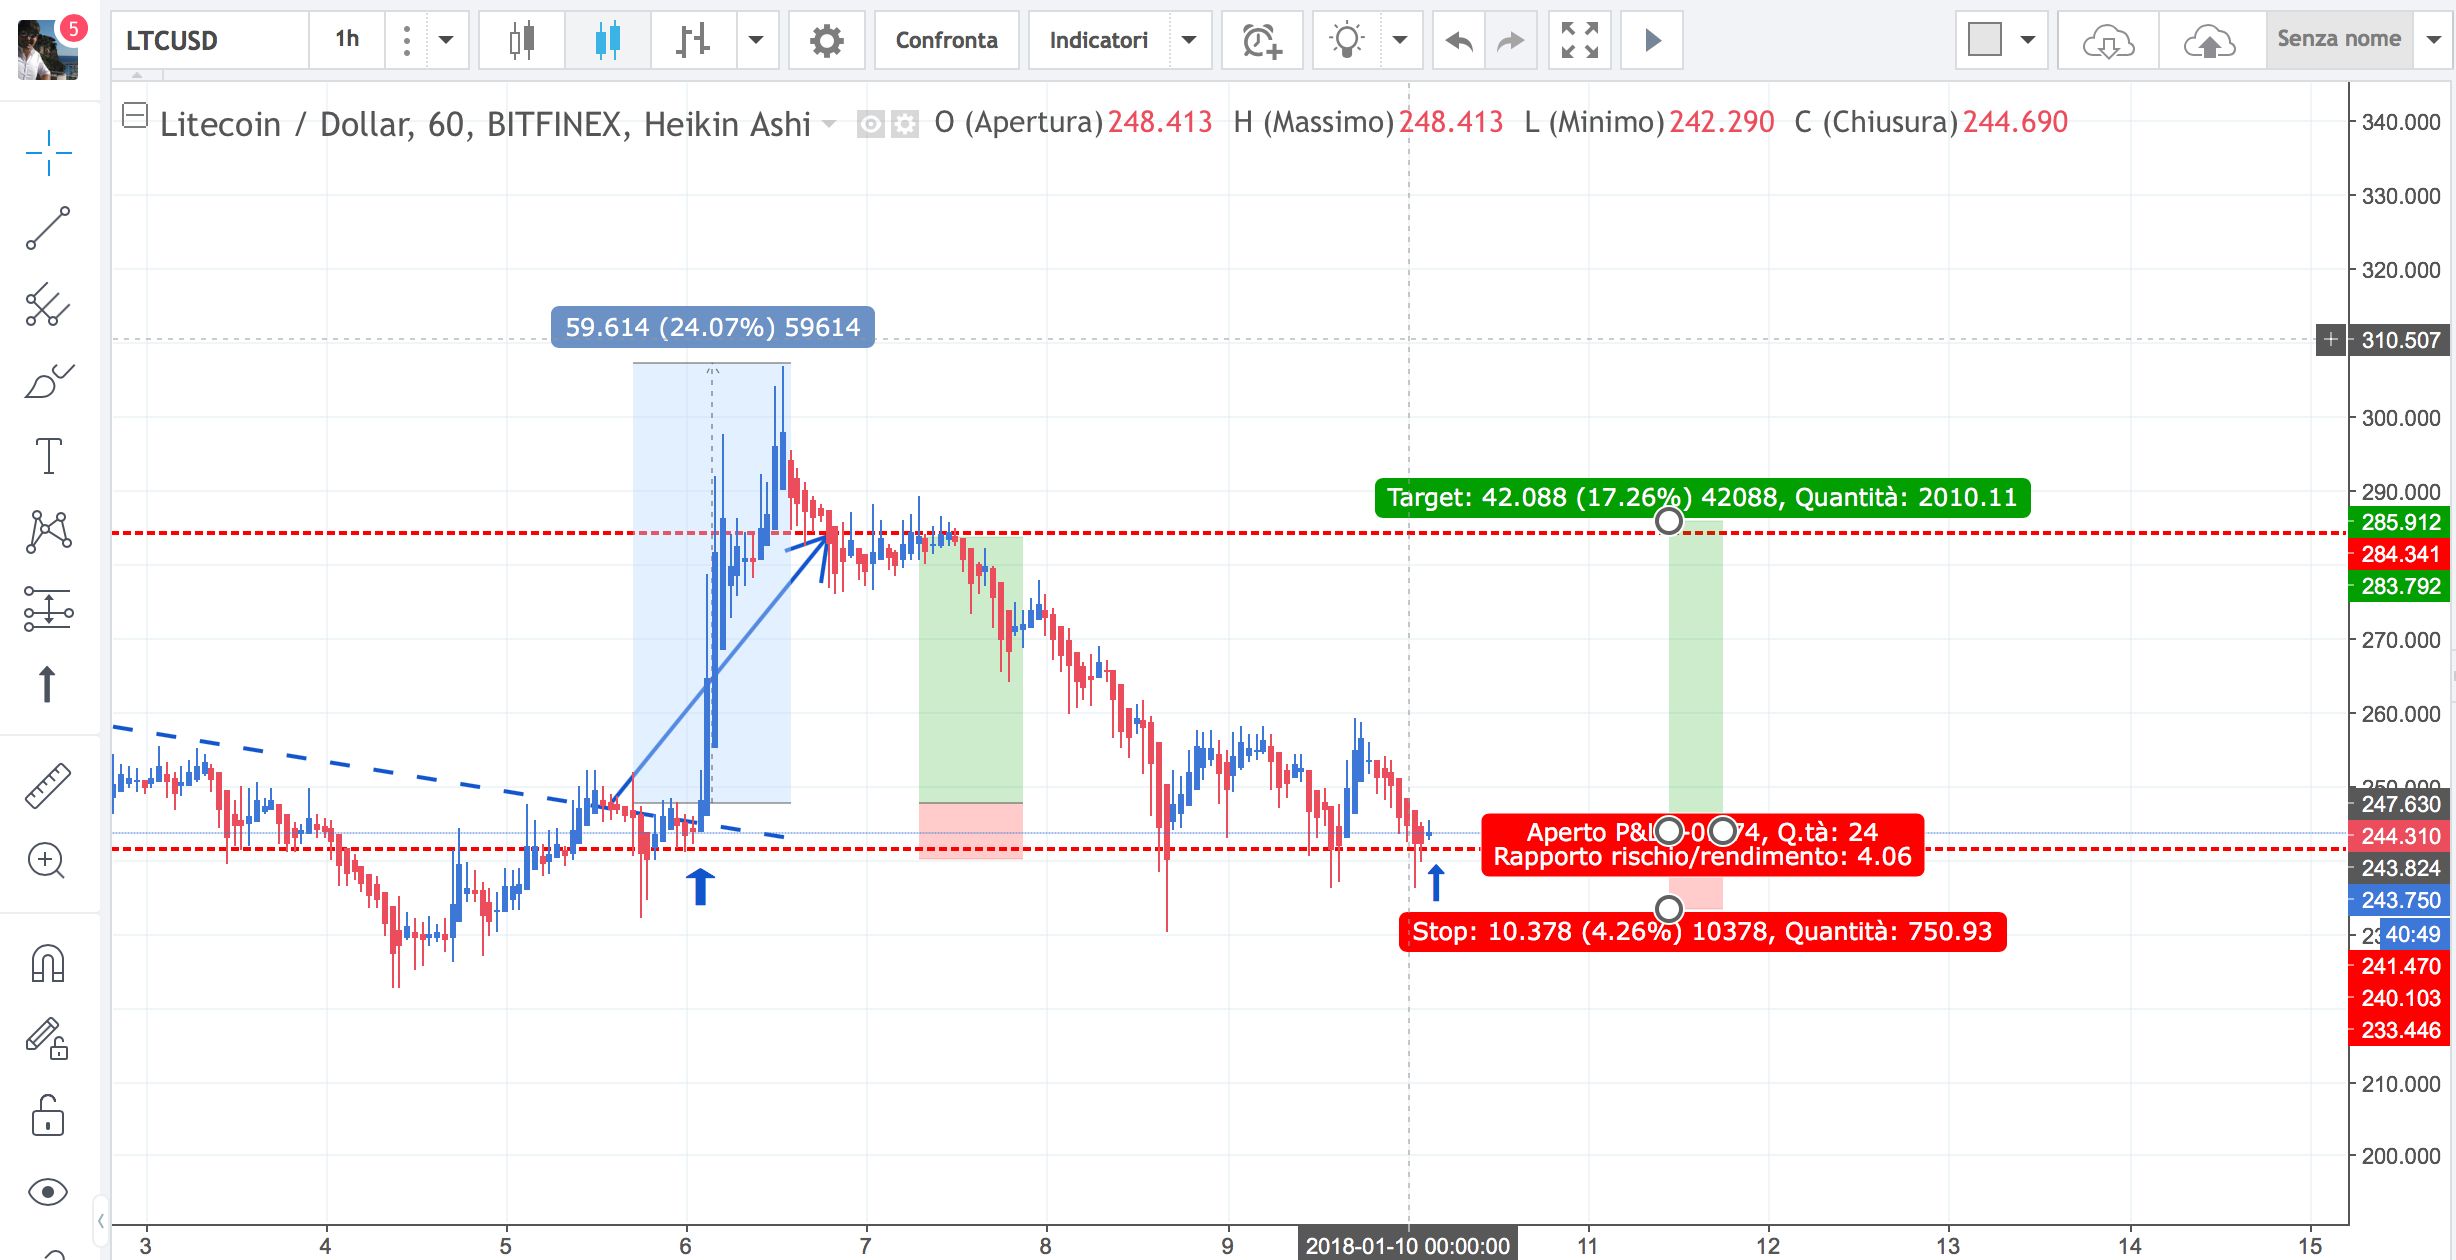
Litecoin - LTC/USD

Litecoin is testing the support again in the 244 USD area. In the Heikin Ashi h1 chart we can see how such support is extremely considered by traders. A close up of a bullish Heikin Ashi candle will be a good Long signal for me.
ITA
Litecoin sta testando nuovamente i supporto in area 244 USD. Nel grafico Heikin Ashi h1 possiamo vedere come tale supporto sia estremamente considerato dai trader. Una chiusura di una candela Heikin Ashi rialzista rappresenterà per me un buon segnale Long.
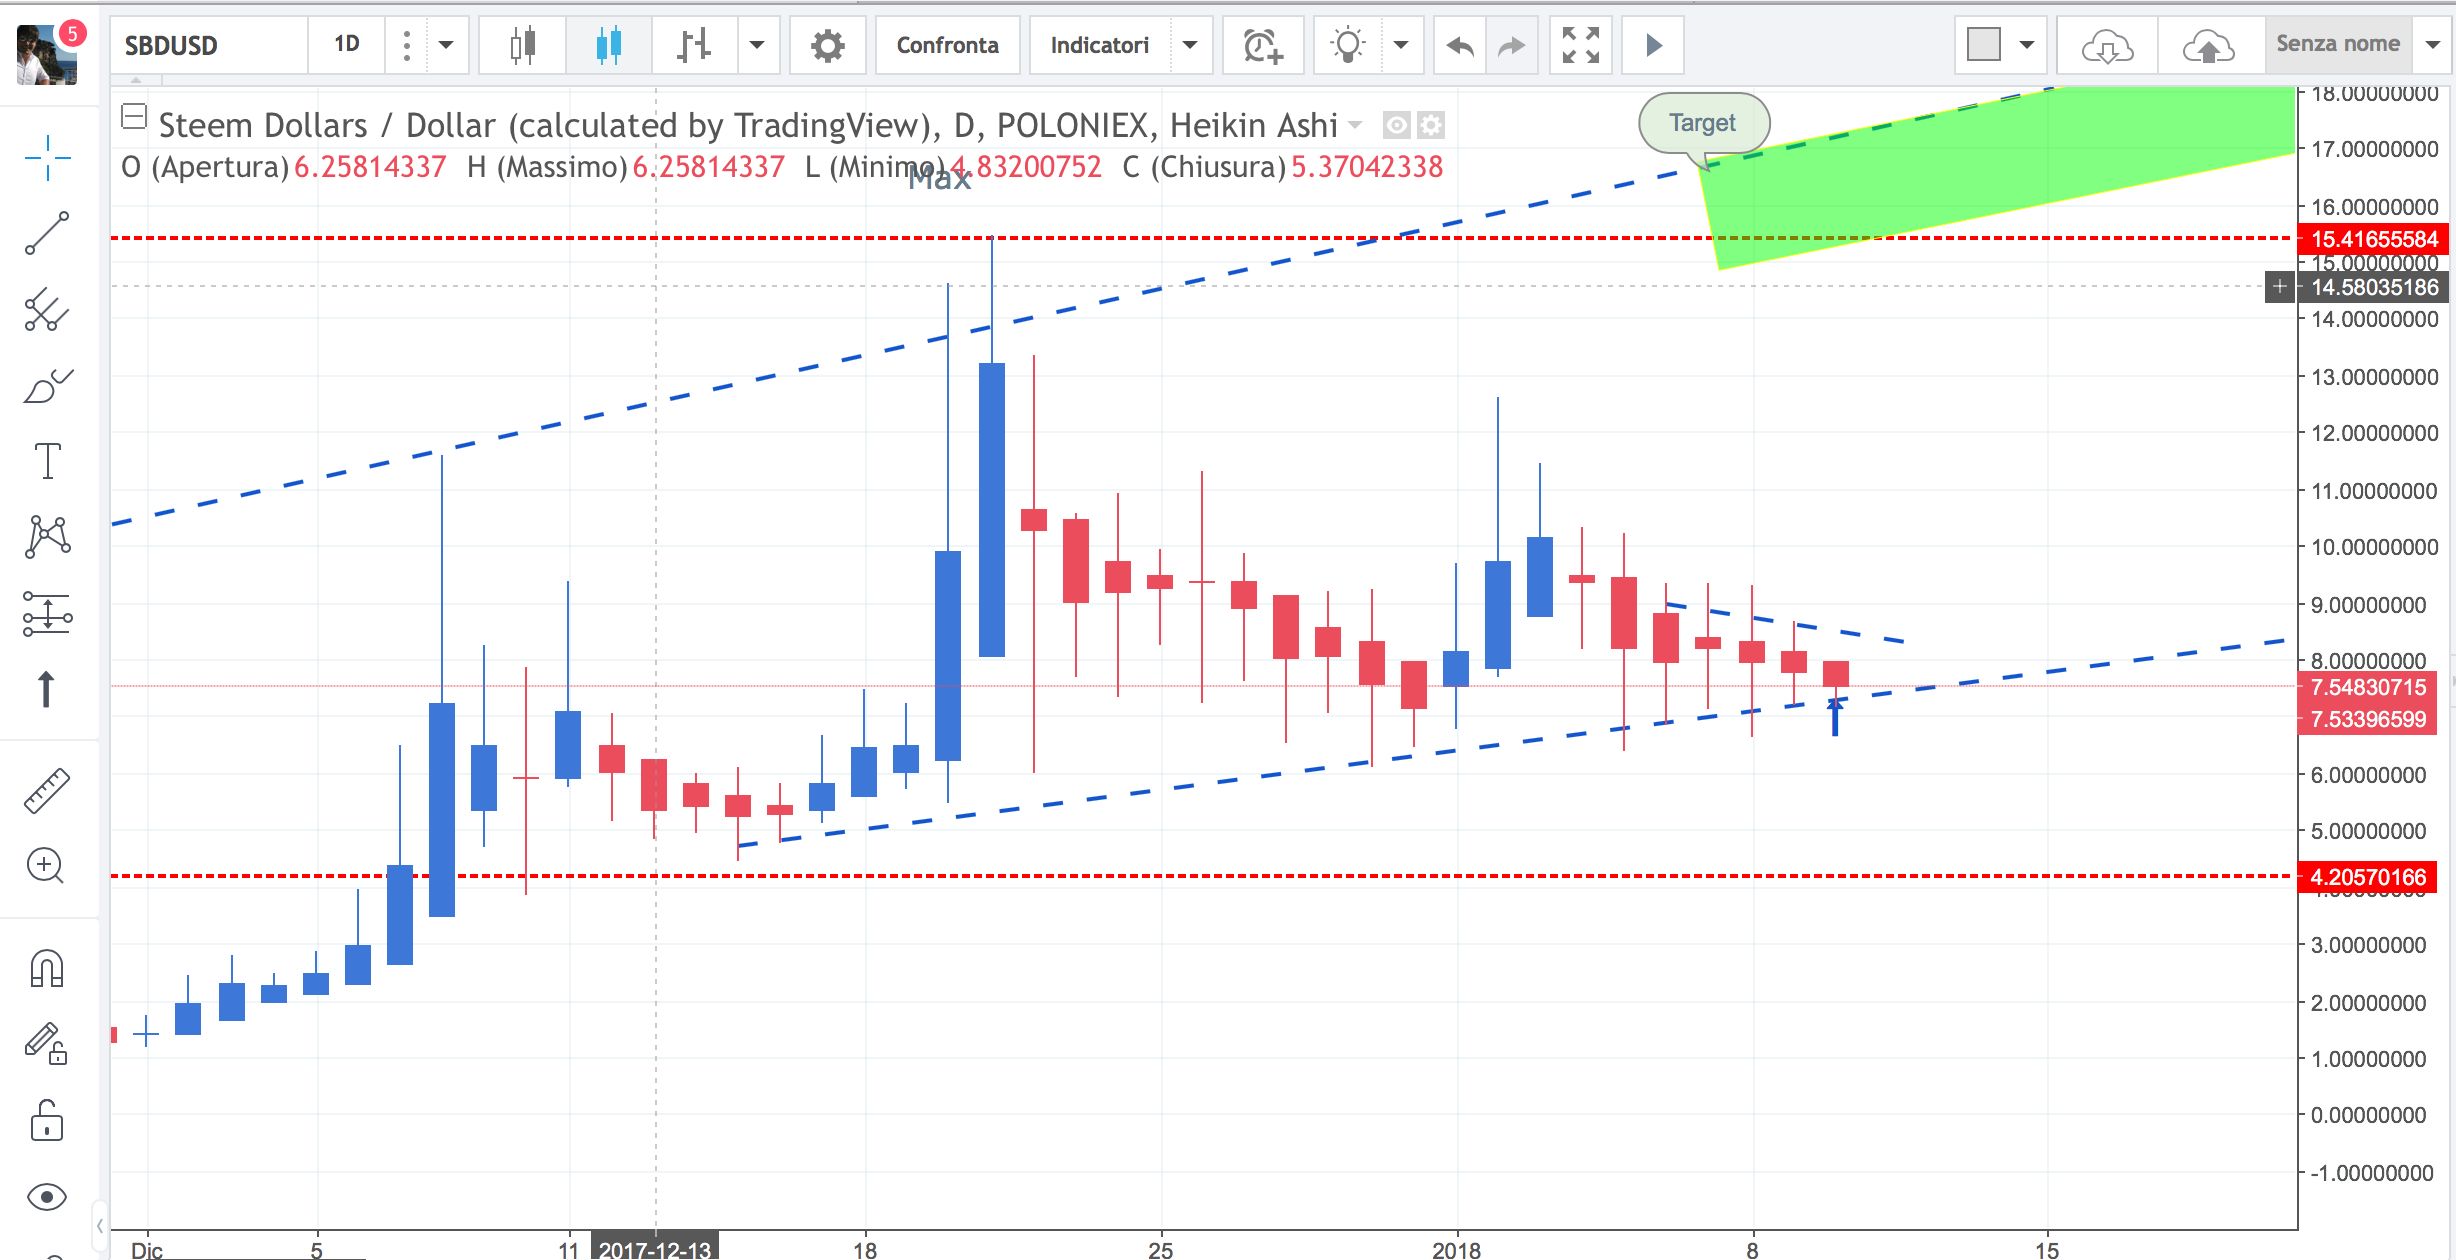
Steem Dollar - SBD/USD
Daily Heikin Ashi Chart

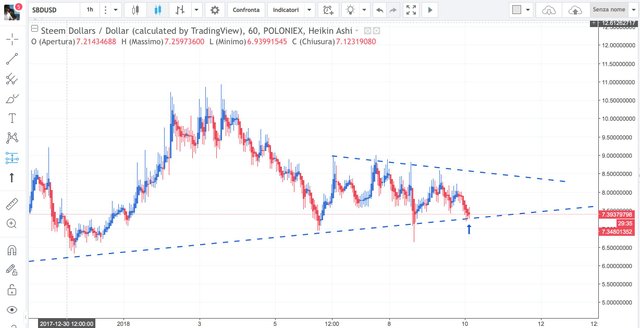
Let's start by saying that Steem Dollar is in a daily bullish trend and is testing a very important dynamic support. Also in the h1 chart we see that lately several times this dynamic support has been tested. Here too, my Long input signal will give me a possible Heikin Ashi candle upside down in h1.
ITA
Cominciamo col dire che Steem Dollar si trova in un trend daily rialzista e sta testando un supporto dinamico molto importante. Anche nel grafico h1 vediamo che ultimamente più volte tale supporto dinamico è stato testato. Anche qui il mio segnale di ingresso Long me lo darà una eventuale candela Heikin Ashi rialzista in h1.
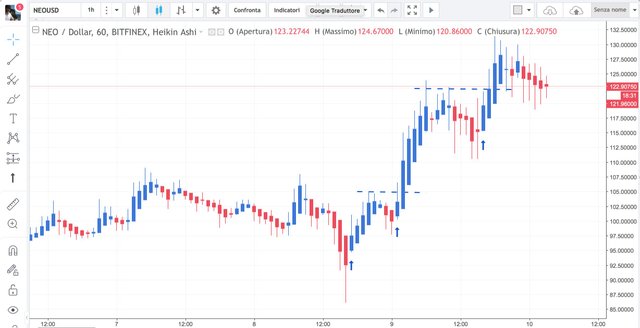
NEO - NEO/USD

I really like the h1 heikin ashi chart of NEO because the heikin ashi candles seem to be respected and you see it by the blue arrows that I entered in the chart. Again, as soon as close a candle heikin ashi bullish I will be ready to enter long.
ITA
Mi piace molto il grafico h1 heikin ashi di NEO perché le candele heikin ashi sembrano essere rispettate e lo vedete dalle frecce blu che io o inserito nel grafico. Anche in questo caso, non appena chiuderà una candela heikin ashi rialzista io sarò pronto ad entrare long.
This strategy applied in the h1 chart can allow us to close each trade with interesting profit percentages with a decidedly low risk. They are all signs in the direction of the main trend and therefore this makes us feel more relaxed, we are not looking for an inversion, but a sign of continuity of the main trend.
ITA
Questa strategia applicata nel grafico h1 ci può permettere di chiudere ogni trade con percentuali di profitto interessanti a fronte di un rischio decisamente contenuto. Sono tutti segnali in direzione del trend principale e quindi questo ci fa stare più tranquilli, non stiamo cercando un inversione, ma un segnale di continuità del trend principale.
Disclaimer
In this article I indicated my operation and I did not provide any trading signals. Anyone who decides to follow my trading ideas will do so at your own risk and relieve me of any responsibility.
ITA
Disclaimer
In questo articolo ho indicato la mia operatività e non ho fornito alcun segnale di trading. Chiunque deciderà di seguire le mie idee di trading lo farà a proprio rischio e pericolo sollevandomi da qualsiasi responsabilità.


Great post bud thanks for sharing learning a lot from you .Could you give me some more insight as to what the Heikin Ashi candle is and where i can study more about it.
Also feel free to give me some feedback on my Technical analysis of Ethereumclassic.I feel it would be great for me to get your opinion.https://steemit.com/trading/@jsonkidd/ethereum-classic-technical-analysis