Bitcoin Price Analysis: Bearish Continuation Pattern Could Signal End of Bullish Rally
Over the last couple weeks, bitcoin has seen a dramatic drop in price dropping from $20,000 to $6,000. Shortly after bottoming at $6,000, hopeful investors jumped at the chance to catch a discounted coin. Is this rise sustainable and does it mark the end of the drastic correction?
Let’s take a look at the macro trend:
SUBSCRIBE
NOW READING: Bitcoin Price Analysis: Bearish Continuation Pattern Could Signal End of Bullish Rally
OPINION
Bitcoin Price Analysis: Bearish Continuation Pattern Could Signal End of Bullish Rally
Over the last couple weeks, bitcoin has seen a dramatic drop in price dropping from $20,000 to $6,000. Shortly after bottoming at $6,000, hopeful investors jumped at the chance to catch a discounted coin. Is this rise sustainable and does it mark the end of the drastic correction?
Let’s take a look at the macro trend:
fig1
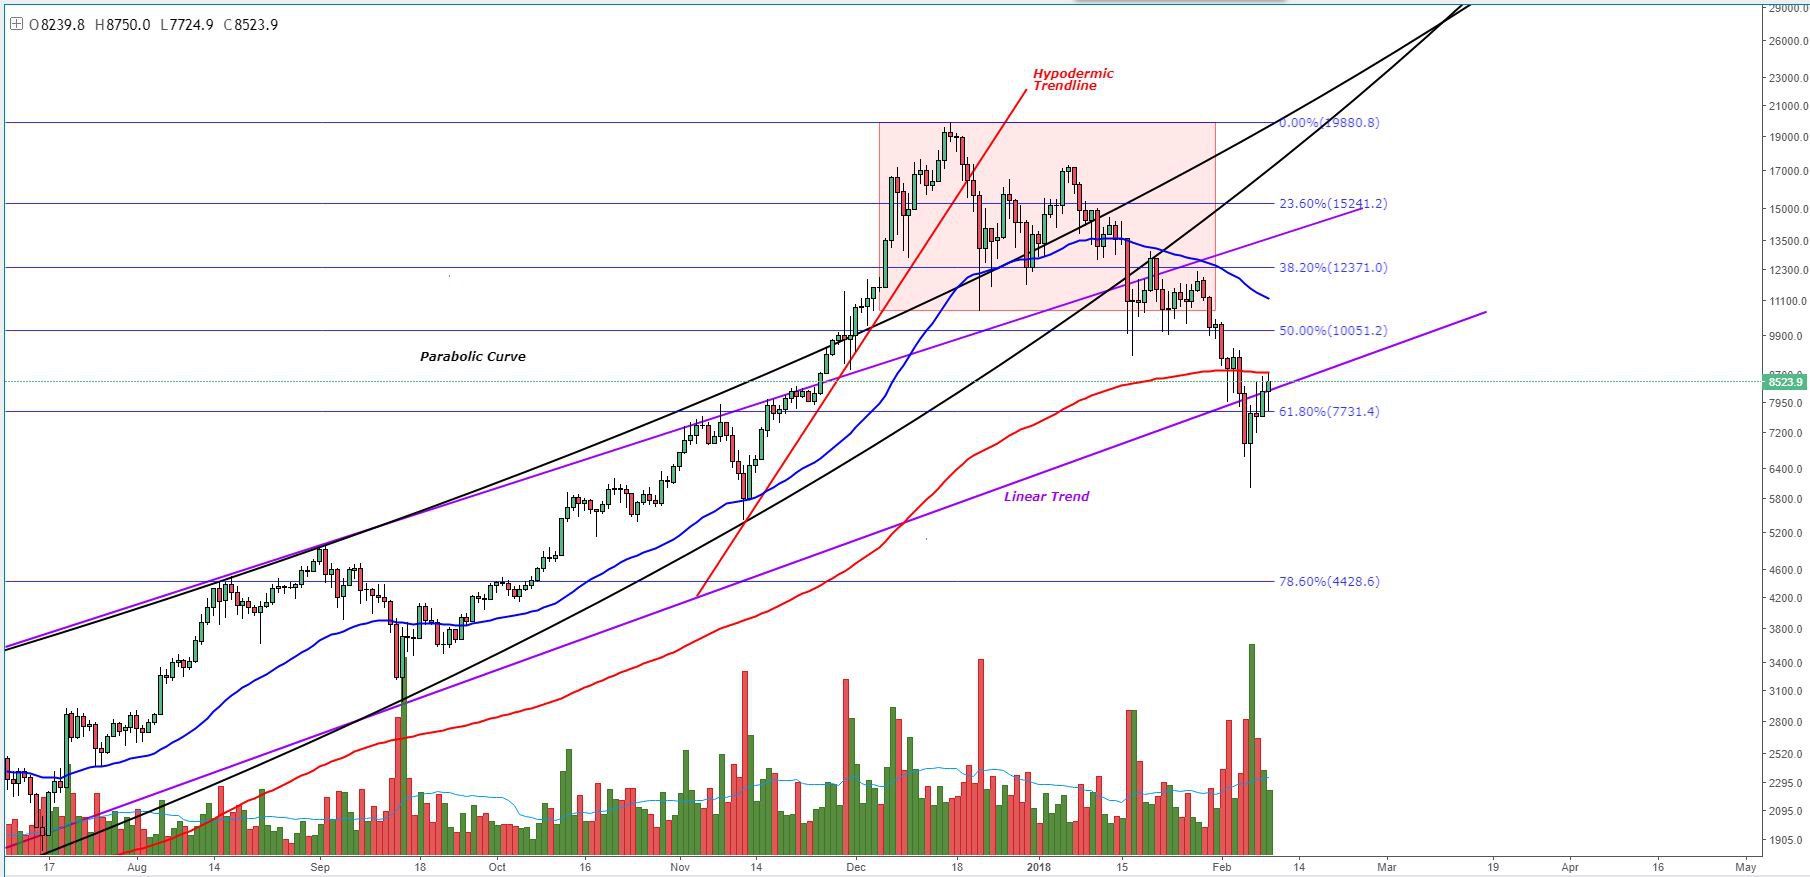
Figure 1: BTC-USD, 1-Day Candles, Macro Trend
One of the most concerning things regarding the health of this trend is the breakdown of both the parabolic and linear trends. Both trends lasted several years and represented the entire life of a multi-year bull market. A breakdown of these trends marks the beginning of a new market and a new trend. Whether this is going to be a sustained bear market or we have bottomed out and are beginning a bull market remains to be seen, but a few things are sticking out that point toward the possibility that this correction might not be finished just yet.

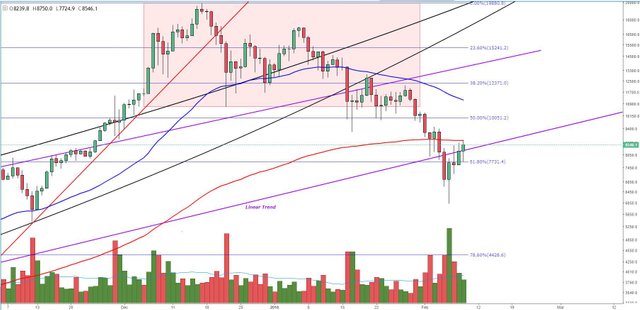
Figure 2: BTC-USD, 1-Day Candles
First, we are currently finding resistance on the 1-Day 200 EMA (the red curve). If we look up at Figure 1, we notice that this is the first time since 2015 (the end of the last bear market) that BTC-USD has been below the 200 EMA. Throughout the life of this bull market, bitcoin has reliably found support on the 200 EMA. However, at the time of this article, the price is trending below the 200 EMA and is currently in the process of testing the strength of its resistance level.
Second, we can see a notable drop in overall volume since the price bottomed out at $6,000. Every single daily candle since we bottomed out has seen less and less volume, indicating a lack of interest from larger buyers at these prices. This price pattern could yield a bearish continuation in the form of a bear flag. Bear flags are brief intermittences in bearish trends where the price temporarily rallies due to bullish speculation, but fails to continue upward. The texbook sign of a bearish continuation is a brief rally coupled with diminishing volume

tern Could Signal End of Bullish Rally
OPINION
Bitcoin Price Analysis: Bearish Continuation Pattern Could Signal End of Bullish Rally
Over the last couple weeks, bitcoin has seen a dramatic drop in price dropping from $20,000 to $6,000. Shortly after bottoming at $6,000, hopeful investors jumped at the chance to catch a discounted coin. Is this rise sustainable and does it mark the end of the drastic correction?
Let’s take a look at the macro trend:
fig1
Figure 1: BTC-USD, 1-Day Candles, Macro Trend
One of the most concerning things regarding the health of this trend is the breakdown of both the parabolic and linear trends. Both trends lasted several years and represented the entire life of a multi-year bull market. A breakdown of these trends marks the beginning of a new market and a new trend. Whether this is going to be a sustained bear market or we have bottomed out and are beginning a bull market remains to be seen, but a few things are sticking out that point toward the possibility that this correction might not be finished just yet.
fig2
Figure 2: BTC-USD, 1-Day Candles
First, we are currently finding resistance on the 1-Day 200 EMA (the red curve). If we look up at Figure 1, we notice that this is the first time since 2015 (the end of the last bear market) that BTC-USD has been below the 200 EMA. Throughout the life of this bull market, bitcoin has reliably found support on the 200 EMA. However, at the time of this article, the price is trending below the 200 EMA and is currently in the process of testing the strength of its resistance level.
Second, we can see a notable drop in overall volume since the price bottomed out at $6,000. Every single daily candle since we bottomed out has seen less and less volume, indicating a lack of interest from larger buyers at these prices. This price pattern could yield a bearish continuation in the form of a bear flag. Bear flags are brief intermittences in bearish trends where the price temporarily rallies due to bullish speculation, but fails to continue upward. The texbook sign of a bearish continuation is a brief rally coupled with diminishing volume.
fig3
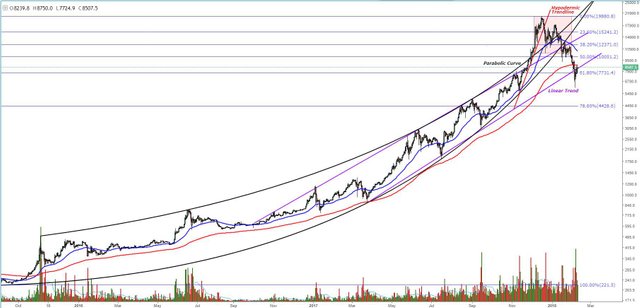
Figure 3: BTC-USD, Daily Candles, Potential Bear Flag
The measured move of this bear flag would have us targeting somewhere between $3,000 to $4,000. I don’t consider this price target out of the question as the all previous bear markets have yielded a 78% retracement in price. Currently, our 78% retracement sits around $4400.
Summary:
Bitcoin has seen a local bottom around $6,000.
A weakening rally has left bitcoin testing strong resistance on diminishing volume.
A potential bearish continuation could send bitcoin down to the low $4,000s, after everything is said and done.
Trading and investing in digital assets like bitcoin and ether is highly speculative and comes with many risks. This analysis is for informational purposes and should not be considered investment advice. Statements and financial information on Bitcoin Magazine and BTC Media related sites do not necessarily reflect the opinion of BTC Media and should not be construed as an endorsement or recommendation to buy, sell or hold. Past performance is not necessarily indicative of future results.

Hi! I am a robot. I just upvoted you! I found similar content that readers might be interested in:
https://www.nasdaq.com/article/bitcoin-price-analysis-bearish-continuation-pattern-could-signal-end-of-bullish-rally-cm919672