TA of the S&P 500. Let's see what the bigger brother could do in the short to mid. term .
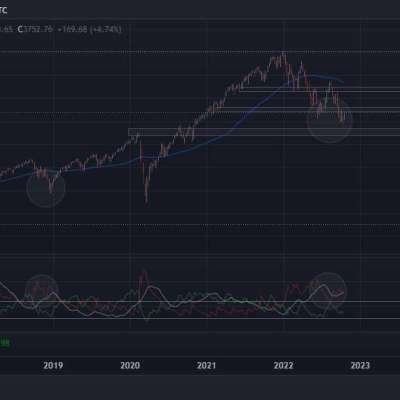
On the chart we could see a clear bullish divergence and a similar case back in 2019. Since this is the weekly chart , we probably have to take it under consideration. (picture 1W chart )
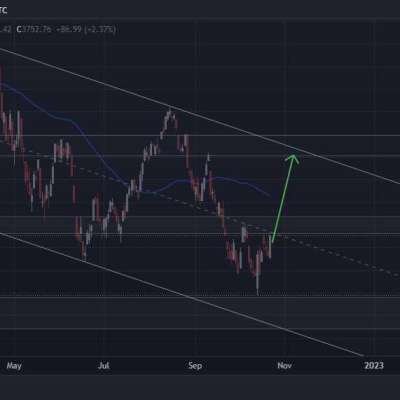
It looks like in the short term we could expect an uplwards move to aprox 4100 where the sellers will probably come in. ( picture 4 h. chart)
Beside that, the P/E Ratio ( for S&P 500 ) is at a current level of 19.69, down from 22.89 last quarter and down from 27.07 one year ago. Meaning that we already have prices much closer to the fair ones for most of the companies . We need to consider that historical average for the SPX P/E ratio is 15-16 .
- many macro specialists still awarn us that we could expect 15 even 20 % more down , because of the current geo-political situation .
of course non of the above is and can not be considered a financial advice !

