💥Accurate technical analysis of XRP/USDT and specific trading signals🎯$XRP 23-07-2025
Introduction
XRP has experienced significant price volatility recently, experiencing strong rallies followed by sharp corrections. In this article, I will provide a comprehensive analysis of the XRP/USDT pair across multiple time frames, providing accurate trading signals for traders looking to take advantage of the current market situation.
Analysis across Time Frames
Weekly
General Trend: The weekly frame shows a strong uptrend since the beginning of 2024, with the price rising from 0.5209 USDT to a high of 3.6118 USDT in December 2024.
Key Levels: There is a bearish order block at 3.6118 USDT, while the current price is at 3.2578 USDT, indicating a test of an important resistance area.
Volume: The high volume during the August 2024 breakout reflects strong buying pressure, but the relatively low volume recently may indicate a slowdown in momentum. Daily Timeframe
Price Action: After peaking at 3.2543 USDT in July, the price corrected to 3.2547 USDT, testing the support level at 2.3233 USDT.
Volume: The increased volume during the correction indicates strong selling pressure, which could increase the likelihood of a continued decline if the support level fails to hold.
4-Hour Timeframe
Peak and Correction: The price peaked at 3.900 USDT and then declined to 3.2495 USDT, with a resistance zone between 3.800 and 3.900 USDT and support at 3.000 USDT.
Volume: The high volume at the peak reflects strong selling pressure, while the current moderate volume indicates a potential consolidation phase.
Hourly Chart
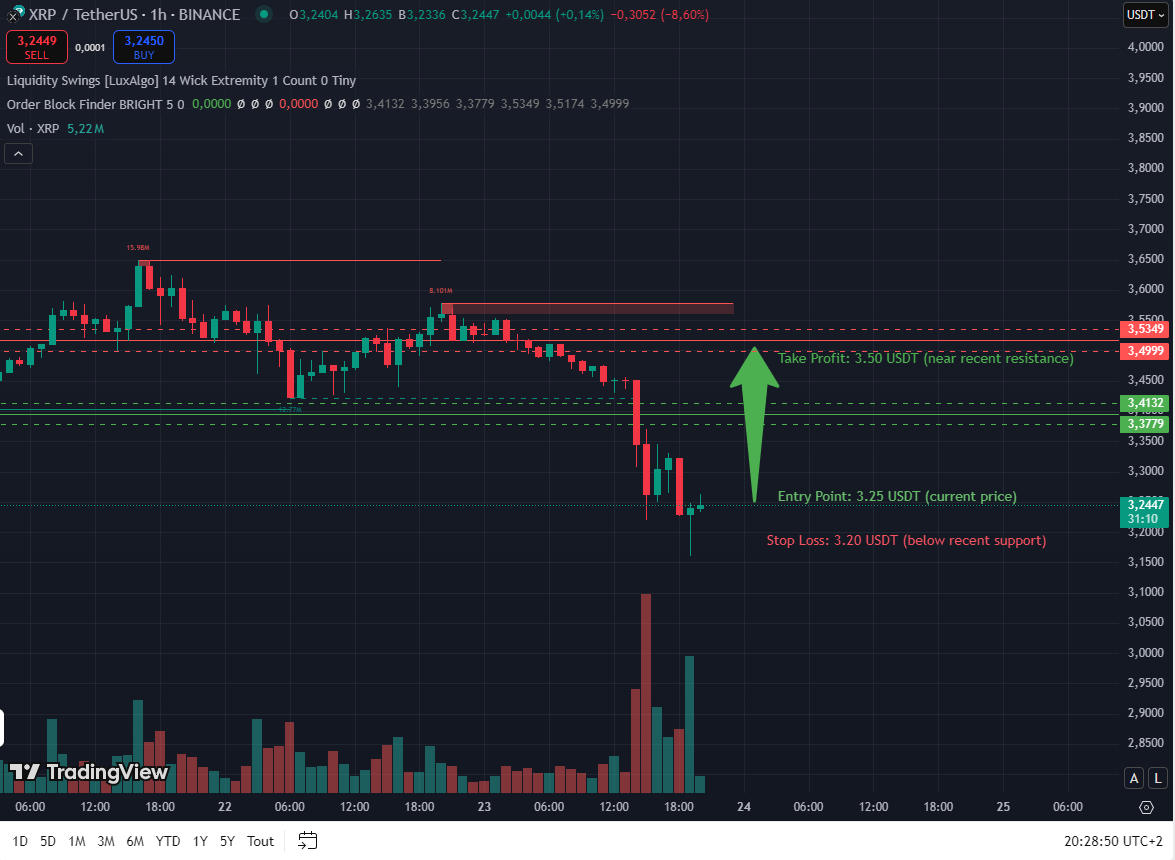
Short-Term Fluctuations: The price rose from 3.2521 USDT to 3.5349 USDT, then declined sharply to 3.2521 USDT with a significant increase in volume, which may indicate a "Liquidity Grab" process.
Levels: Resistance zone between 3.4999 and 3.5349 USDT, and immediate support at 3.2521 USDT.
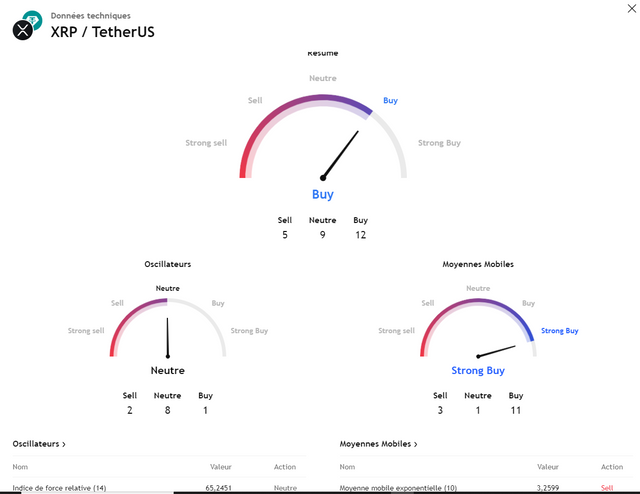
Technical Indicators
Overall Summary: A "buy" signal with 12 buy signals versus 5 sell signals.
Oscillators: Neutral with a slight sell bias, with the Relative Strength Index (RSI) at 65.2451 (not yet overbought).
Moving Averages: A "strong buy" signal with 11 buy signals, supporting the overall uptrend.
Trading Signals
Based on the above analysis, here are two accurate trading signals:
Buy Signal
Entry Point: 3.25 USDT (current price)
Stop Loss: 3.20 USDT (below recent support)
Take Profit: 3.50 USDT (near recent resistance)
Rationale: The price is at a key support level within a general uptrend. Holding above 3.25 USDT could lead to a rebound towards 3.50 USDT or higher.
Risk-to-Reward Ratio: Around 1:5 (risk 0.05 USDT to gain 0.25 USDT).Alternate Sell Signal
Entry Point: Below 3.20 USDT (upon confirmation of the breakout)
Stop Loss: 3.30 USDT
Take Profit: 3.00 USDT
Rationale: A breakout of the support at 3.20 USDT with strong volume could signal a deeper correction towards the next support level at 3.00 USDT.
Risk Management
Trade Size: Adjust your trade size to suit your capital and risk tolerance, especially given the current volatility.
Trailing Stop Loss: Use a trailing stop loss to lock in profits or minimize losses.
Follow-up: Monitor the market for any changes in sentiment or news that could affect the price.
Conclusion
XRP is currently at a critical point, with the potential to resume its upward trend or enter a deeper correction. The fundamental signal supports buying on dips given the overall uptrend, but traders should exercise caution and employ solid risk management strategies to deal with potential volatility.