import numpy as np
import matplotlib.pyplot as plt
import math
def creat_graph():
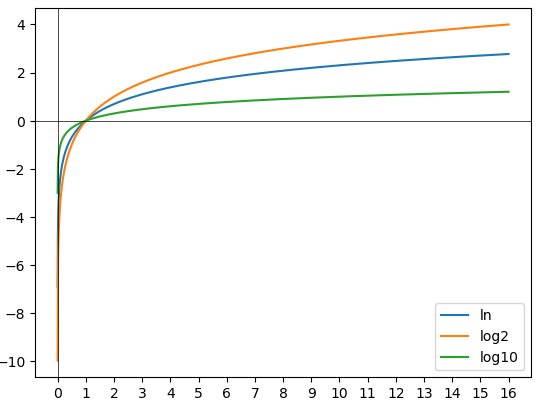
x = np.linspace(0.001,16,2000)
y_e = np.log(x) #natural log! y = lnx
y_2 = np.log2(x) # y = log_2(x)
y_10 = np.log10(x) # y = log_10(x)
plt.plot(x, y_e)
plt.plot(x, y_2)
plt.plot(x, y_10)
plt.legend(['ln','log2','log10'], loc = 'lower right')
plt.xticks(range(math.floor(min(x)), math.ceil(max(x))+1))
plt.axhline(0, color = 'black', linewidth = '0.5')
plt.axvline(0, color = 'black', linewidth = '0.5')
plt.show()
if __name__ == '__main__':
creat_graph()