TIB: Today I Bought (and Sold) - An Investors Journal #343 - Oil Services, Paper Manufacture, Australian Fixed Income, Altcoins (FUEL)
Jay Powell and strong jobs report calms the markets. Time to focus on data again. Switching out of paper into oil services and topping up bond exposure in the pension portfolio. 56 Percent club update for November now done and a few more covered calls written (and reported)

Portfolio News
Market Selloff
Data and a steady hand sways market mood by a huge margin.
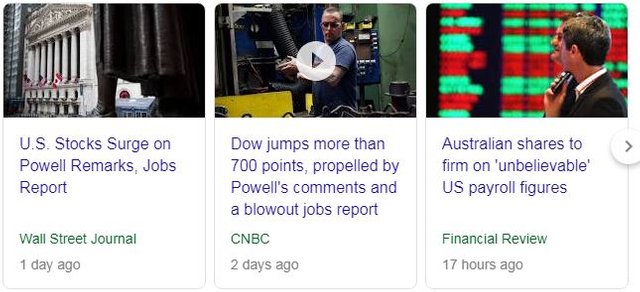
US jobs report came out on Friday with 342,000 new jobs created way ahead of estimates (nearly double = way ahead). And Federal Reserve chairman, Jay Powell, applied the steady hand saying the Fed would be patient, especially with muted inflation. Lurking in the jobs report was an improvement in the participation rate which helps to slow the pace of wage rises. The markets have been worrying about 3 things really
- China and the tariff war. A US negotiation team arrives in Beijing on Monday to resume talks
- Slowing economic growth. Trade talks may address some of that. China actions to improve credit through reducing reserve ratios taken on Thursday will allay some of the fears
- Federal Reserve being too aggressive on rate hikes. Jay Powell said they would be patient.
Fear over and markets rebound. No more so than in interest rate markets with Euribor and Japanese Government Bonds giving back 7 and 25 basis points respectively in Friday trade (and releasing a lot of margin pressure in my IG Markets account)
Before we get too carried away, it is time for a quick step back to review the bigger employment picture using the total unemployed, plus all marginally attached workers plus total employed part time for economic reasons data (U6 Rate)
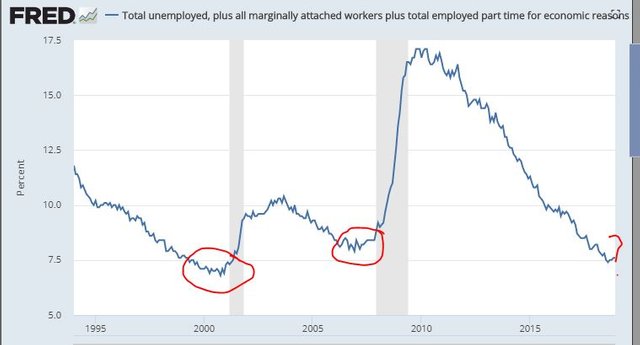
https://fred.stlouisfed.org/series/U6RATE
Note: this chart does not have December data in it
This rate is a key indicator for measuring the real rate of unemployment. It reached a low of 7.4% in August 2018 and has tracked higher since then. By no means should one look at this as a leading indicator but it will be worth watching over coming months as we look back to 2000 and 2008 when it also reached lows.
Next chart looks at wage rates which have shown steady but stable growth over the last 18 months. At 4.6% this is well above the target inflation rate but well below long run average of 6.22%
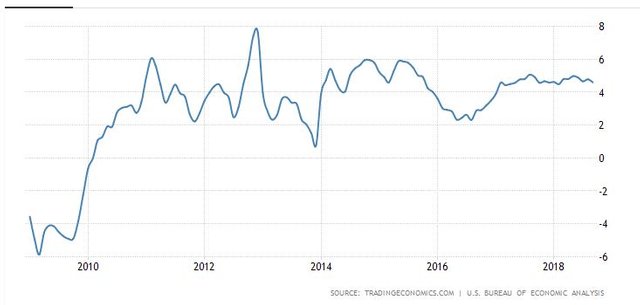
https://tradingeconomics.com/united-states/wage-growth
The big question is for how long inflation remains muted with OPEC oil production cuts likely to push up the price of oil
Bought
Schlumberger (SLB): US Oil Services. I added a small parcel on an idea from Jim Cramer
We have patiently waited and waited and waited before adding to our SLB position because we wanted to see oil prices make a stand, and we have gotten exactly that over the last few trading sessions.
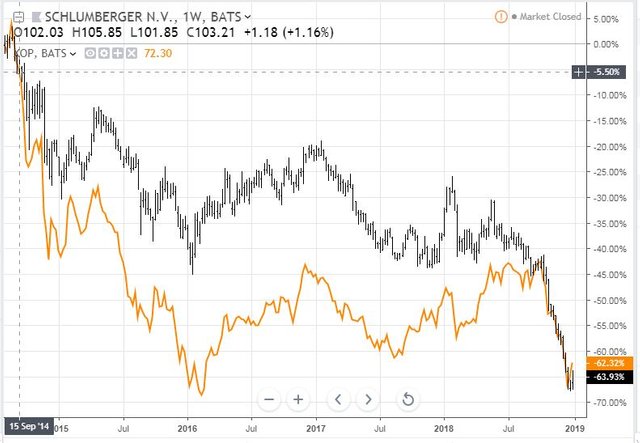
Schlumberger operates mostly in oil services and price is correlated with oil prices. Two charts though tell quite different stories, the first is a cycle of oil prices from the 2014 highs to now - SLB (black bars) has performed in line the SPDR Oil Producers and Explorers ETF ending at the same place (XOP - orange line)
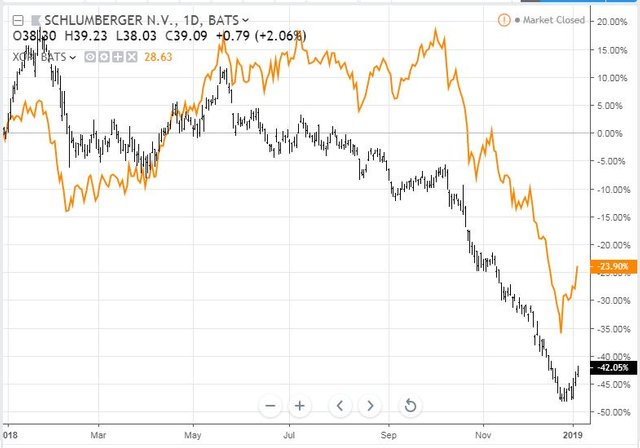
Take a different timeline (daily chart going back 12 months only) and Schlumberger has lagged its customer industry by 19 points - close half that gap and there is close to a 10% return to add to the 5.4% dividend yield
The key for me is the way the chart has made a bottom. With OPEC accelerating its production cuts and promising to be more responsive to market conditions, I fully expect to see this as the bottom for oil prices (until the next recession hits)
Queensland Treasury 3.25% 21 July 2028 Bonds I have been holding off replacing the last maturing bonds in my pension portfolio until I saw a bottoming in the fall in yields. Implied yield of 2.75% is a bit lower than the last Treasury Victoria 4.25% bonds I bought. With 10 years to maturity I am sure I will find a point to exit with some capital growth.
Sold
WestRock Company (WRK): US Paper Manufacturer. Price did not make the rebound I expected and slid hard in the selloff (see TIB315). When Jim Cramer exited his position I held on as mine was a smaller percentage than his. He has been progressively moving out of weak names through the selloff to switch into stronger names - this is one of those cases with a straight swap out of WRK and into SLB. Booked a 12% loss since November 2018 (after accounting for covered call premiums received)
56 Percent Club
Avid readers will have been wondering where the November 56 Percent Club report went. It got waylaid by holidays and other complications. Rather than skip it or combine it, I have put it together as it has some interesting points.
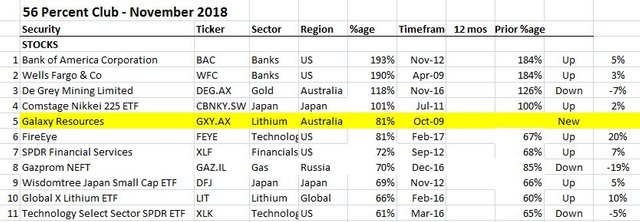
First is the table of stocks. I have highlighted ones that are new to the club in Yellow. I have also marked up whether they have gone up or down since last time.
What stands out?
- The list has shrunk by 1 stock only (12 vs 11). I did sell October number 1, JP Morgan (JPM) and Dutch insurer, Aegon AS (AGN.AS) dropped off the list
- US Banks continue to dominate the top of the list with Bank of America (BAC) jumping Wells Fargo (WFC) to replace JP Morgan (JPM - sold). Both banks went up with anticipation of Federal Reserve rate hikes
- There was only one new entrant, with lithium miner Galaxy Resources (GXY.AX) coming back after dropping out in October
- Last month's new entrant, FireEye (FEYE) holds onto the list and moves up 2 slots and is biggest mover up. Biggest faller is last month's biggest riser, Gazprom NEFT (GAZ.IL)
- Dropping off the list is Dutch insurer, Aegon AS (AGN.AS)
- With the return of Galaxy Resources, there are now two resource stock on the list. I expected the other, De Grey Mining (DEG.AX), to begin to behave as a hedging trade if gold price rises. It went down.
- None of the stocks were bought in the last 12 months
- 7 risers, 3 fallers/flat and 1 new.
On the options side same deal with Shorts marked in red text - i.e., for trades where I am expecting the market to go down.

What stands out?
- Selloff continued to hit hard with the list shrunk by another 5 since last time (9 vs 14) with two sales (list would have been 11).
- There is a new leader in Consumer Staples Select Sector ETF (XLP) supplanting Eurodollar 3 Month Rate puts. The positioning of both of these trades suggests the market is becoming more defensive
- Only 1 new entrant in cybersecurity supplier, FireEye (FEYE)
- Sales made in US pharmaceutical retail, Walgreens (WBA) and profitable closing of Nasdaq hedge puts (QQQ)
- Dropped off the list are 3D printer (DDD), French utility, Electricite de France (EDF.PA), offshore driller Gulfmark (GLF) following its merger with Tidewater (TDW) and S&P500 puts
- Biggest casualty for the month is again oil with only Royal Dutch Shell (RDSA.AS) remaining and dropping 41 points.
- Fastest riser is US networking supplier, Cisco Systems (CSCO).
- 4 out of 9 positions were bought in the last 12 months.
- 3 risers, 5 fallers/flat and 1 new.
Income Trades
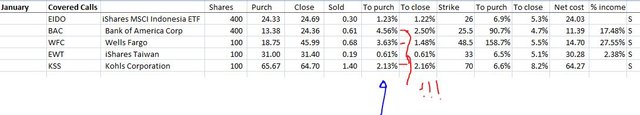
One new trade added with the strong rise in prices
iShares MSCI Indonesia ETF (EIDO): Indonesia Index.
Trades not reported from December 28 - amazing premiums based on rising implied volatility
Bank of America Corporation (BAC): US Bank
Wells Fargo (WFC): US Bank
iShares Taiwan ETF (EWT): Taiwan Index.
Kohls Corporation (KSS): US Retail.
Here is the new table - note how high the premiums are.
Cryptocurency
Bitcoin (BTCUSD): Price range for the weekend was $310 (8.2% of the low). I wrote on Friday
The key for any push higher is for price to make a higher low - if not we will be back to the bottom of the range.
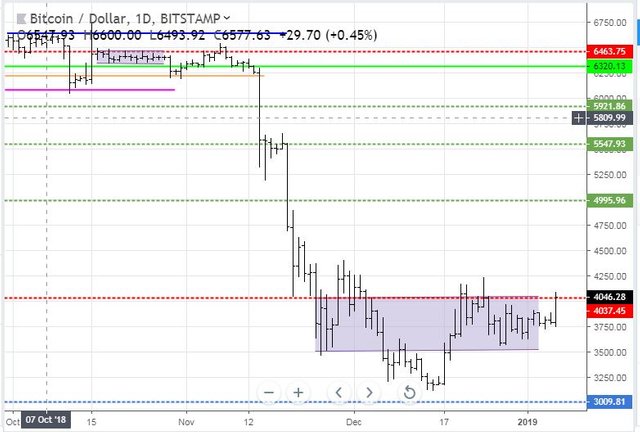
Well we did get the higher low and price had a go at pushing through the top of the range above $4036. This level is a key level now and we need to see price push past the last high at $4250 to have any conviction about a leg higher.
Ethereum (ETHUSD): Price range for the weekend was $17 (12% of the low). I wrote on Friday that this
feels like the pullback to test a run to break the $160 level
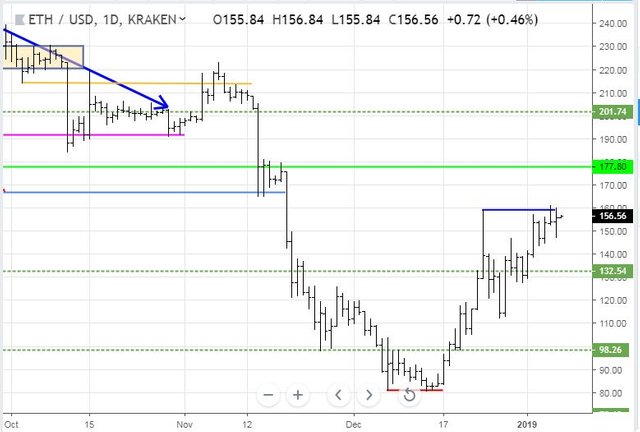
Price did exactly that and had a run past the prior high and then paused. We need to see price make a higher low before there is any conviction of a run to test $177.
CryptoBots
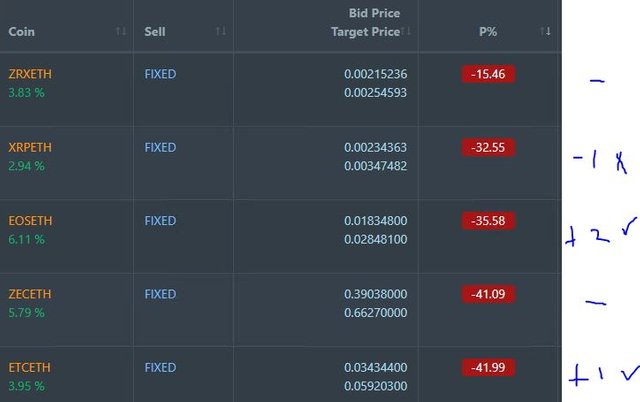
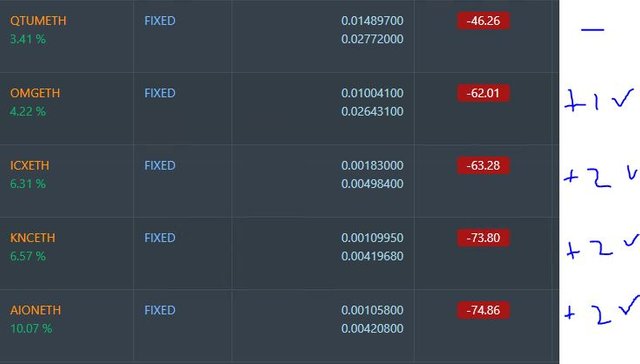
Outsourced Bot No closed trades. (222 closed trades). Problem children remains at 19 coins. (>10% down) - DASH (-72%), ETH (-63%), ZEC (-71%), AE (-43%), LTC (-51%), BTS (-67%), ICX (-85%), ADA (-70%), PPT (-85%), DGD (-83%), GAS (-88%), SNT (-65%), STRAT (-69%), NEO (-84%), ETC (-63%), QTUM (-78%), BTG (-72%), XMR (-50%), OMG (-76%).
Coins moved in a tight band of 1 or 2 points, mostly up. QTUM dropped 2. GAS (-88%) remains the worst coin.
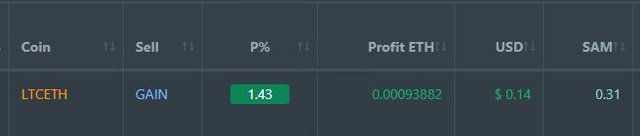
Profit Trailer Bot One closed trade (1.43% profit) bringing the position on the account to 5.22% profit (was 5.20%) (not accounting for open trades).
Dollar Cost Average (DCA) list remains at 5 coins with 4 coins improving.
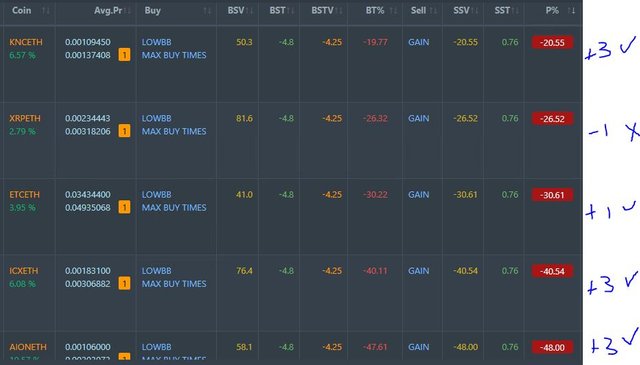
Pending list remains at 10 coins with 6 coins improving, 3 coins trading flat and 1 worse.
PT Defender continues defending 9 coins with no change.
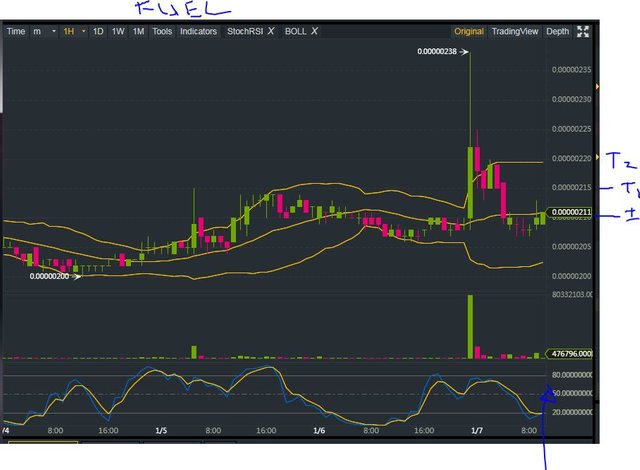
New Trading Bot Trading out using Crypto Prophecy. No closed trades. Added one DCA trade on FUEL based on bounce after pump and dump. 2 targets set.
Currency Trades
Forex Robot Checked the VPS to see why trades closed last week. It reports that license needs to be revalidated - not fixed yet. Funds should be safe.
Cautions: This is not financial advice. You need to consider your own financial position and take your own advice before you follow any of my ideas
Images: I own the rights to use and edit the Buy Sell image. News headlines come from Google Search. Employment and wages charts are credited below the charts. All other images are created using my various trading and charting platforms. They are all my own work
Tickers: I monitor my portfolios using Yahoo Finance. The ticker symbols used are Yahoo Finance tickers
Charts: http://mymark.mx/TradingView - this is a free charting package. I have a Pro subscription to get access to real time forex prices
Crypto Prophecy provides a useful tool to identify oversold and overbought coins - https://mymark.mx/CryptoProphecy
January 4, 2019
The problem with economic indicators is that not only do they continue to be only backwards looking but even from the charts you can see that the way down is much faster and often unanticipated that the grind higher. 2019 will be a pivotal year to determine if it plateaus or falls off a cliff!
Posted using Partiko iOS