Steem Price Analysis | 21 March, 2025
.png)
This is my latest version of the Steem Price Analysis series, those who continuously follow me, they're aware of this one. So, let's get started:
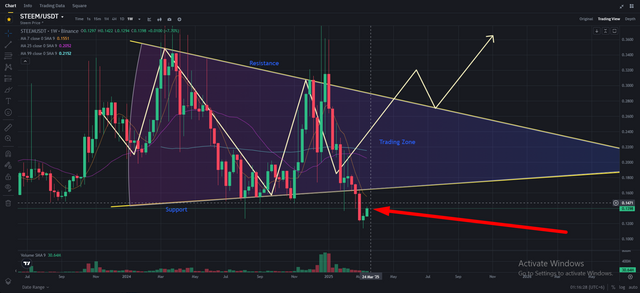
This chart shows the STEEM/USDT trading pair with a weekly timeframe. This graph shows an orderly price movement in a defined range with price fluctuations creating a familiar pattern. The general trend has had phases of rising and falling momentum, indicating changes in buying and selling interest over time. The movement remains within a general formation, implying an existing phase of consolidation or transition.
Multiple trendlines indicate an orderly movement of price, with limits that have influenced price responses earlier. The configuration illustrates a cycle where price tests specific zones before directional action. The repeated interactions in some levels indicate areas where market participants are actively engaging.
Moving averages provide another dimension of information, which shows the relative position of the price in comparison to past performance. If price remains below these indicators, it is generally an indication of the continuation of a direction set, while prices breaking above them may be an indication of a change in sentiment. Observing the behavior of the price against these levels can provide a sense of the tendencies to come.
Volume also has a critical role to play in determining the general trend. Periods of higher activity usually coincide with points at which the price has more extreme reactions, an indication of the level of participation. Recent oscillations show oscillations in volume, suggesting reversals of interest that can impact future movement. A sustained pick-up in activity tends to follow extreme changes in direction, and its fall can signal a lack of strong momentum.
The overall formation appears to be guiding price action along a channel of defined resistance and support. Market action along this range will determine the next development, whether a continuation of the existing pattern or a changeover to another trend. The combination of price, volume, and previous movements will determine future directions.
Observing the price action in response to past trends and market behavior will enlighten us on possible future scenarios. The current trend is still within an expected paradigm, and future events will inform us whether the price stays in its current cycle or breaks towards a different momentum phase.
VOTE @bangla.witness as witness

OR

Thanks
Looking at the price action and volumes, it seems as if no one is interested in making big trades here. It is possible that big players are silently building positions here but clarity will not be found until it goes out of this range.