Steem Price Analysis | 21 February, 2025
.png)
This is my latest version of the Steem Price Analysis series, those who continuously follow me, they're aware of this one. So, let's get started:
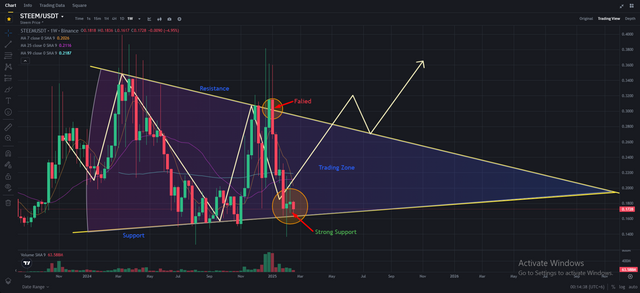
The STEEM/USDT weekly chart presents a clear pattern of symmetrical triangle formation with the price hovering around a pivotal support level. The price had tried to close above the resistance but was not successful, hence a pullback towards the lower trendline. This area is providing strong support, and the market is settling within the range of trading. The action implies that a massive breakout in either direction may occur shortly.
If the price remains at this strong support, a reversal can occur, resulting in a retest of the upper resistance line. A breakout above the resistance can initiate a strong bullish rally, sending STEEM to higher prices. Conversely, if the price breaks below the support, it may indicate further downward movement. The next several weekly closes will be instrumental in deciding the direction.
Now, the moving averages still show that the price is weak because it's still below the 7-day, 25-day, and 99-day moving averages. It means short-term momentum remains bearish but can shift if the buyers come in. The volume is also critical—if there's rising buying volume around this level of support, then it could affirm a potential bullish reversal.
A symmetrical triangle pattern tends to be followed by a strong move and there should be a wait for a breakout confirmation before acting. If the resistance is breached, STEEM may head into bullish territory, but in case of failure of the support, more decline can be anticipated. It's a waiting period currently, and patience will be the virtue of traders awaiting the next major move in STEEM.
VOTE @bangla.witness as witness

OR

Thanks
