Moving Charts: TRX Value Per Coin Analysis | 10% To @tron-fan-club
Hello and welcome to everyone at the Tron fan club. TRX has been performing great in the last few months. This was another eventful week for TRX. We have seen the token lose a substantial amount of value. Today we look back at the price movements of TRX over the last few days.

Made with Canva.
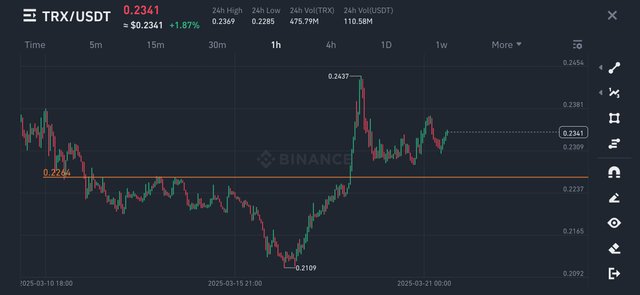
TRX has been experiencing a strong uptrend since August 2024, with its price doubling during this period. While many other cryptocurrencies encountered significant challenges, TRX reversed its movement and started going down. But in the beginning of the week, it fluctuated a lot.
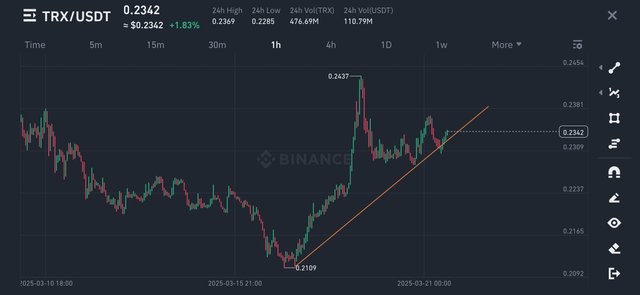
After a slight fall at the beginning of the week and then getting bounced at 0.211$, TRX eventually showed it strength. So the rise after that was sharp. It was just above 0.22$ only seven days ago. TRX is up 5.5% in a span of seven days. It is still below the resistance level of 0.247$ which is one of the crucial level. So, it needs to hold onto the support below and break-though the resistance. Now, TRX is hovering around 0.234$.
All Screenshots are taken from Coingecko
No words from this article should be taken as financial advice.
VOTE @bangla.witness as witness

OR

Moving Charts: TRX Value Per Coin Analysis is a great post you Have shared.
You really have identified a nice lower-low structure in hourly TF. Something similar can be seen in daily TF as well.
https://x.com/Arsalaan00070/status/1903020812690657666?t=bI9LNYGc3bZhg4td1cEn-w&s=19