Psychology of Trend Cycles - Crypto Academy / S6W4 - Homework post for professor @reminiscence01

Cover Image Created using PosterMaker App
Hello, Steemians. I am very happy to be participating in the academy lectures again for the new week. I saw from the list of courses released this week that are important topics in the crypto space. For the time being, I have read the lecture presented by professor @reminiscence and I will be writing the homework task given by the professor at the end of the wonderful lecture.
Question 1
Explain your Understanding of the Dow Jones Theory. Do you think Dow Jones Theory is Important in technical analysis?
Dow Jones theory otherwise called Dow Jones Theory of Trends is a work of the man known by the name Charles H. Dow that was developed in the year 1897. Dow Jones theory' analysis believed every market behavior of any financial product is discounted on the price of the product. That is, demand, supply, and other information has a direct effect on the price of the asset and it determines the direction of the market, appreciating or depreciating.
Dow theory lets us know that the market can be in a trend or trendless, that is bearish or bullish, or sideways. Dow theory presents accumulation and distribution as the psychology behind the trend or trendless state of the market. The theory states that a trending market in the bullish direction has higher highs as the trend continues and lower highs as the bearish trend continues.
Furthermore, Dow's theory proved that a trend will continue as long as a clear reversal is not seen yet. Dow establishes that the beginning of a bullish trend starts with accumulation when demand for the asset is getting concentrated and reaccumulation at the top in the bullish trend as the trend continues. Dow also establishes that the bearish trend starts with distribution when the selling pressure is high and redistribution below as the bearish continues.
These markets state aforementioned continues as long no clear reversal was sighted. Dow also establish that volume will always confirm a trend, high buy volume confirms a bullish trend and high sell volume confirms a bearish trend, and a low volume in a prevailing trend shows a weaker trend.
Is Dow Theory Important in Technical Analysis?
Yes, it is very important. Dow's theory is not only theoretical but practically proven. For this aforementioned reason, Dow theory is very important in technical analysis as it practically fulfills the trend conditions. For every strong bullish trend, a high volume of purchase would confirm the trend which starts with accumulation according to the theory, there are levels when the price of the asset has some pullbacks due to traders taking profit from the market and higher highs in a strong trend can be seen.
Furthermore, it occur in a strong bearish trend when there is a high volume of sell which starts with distribution, and on the way down, some traders may buy the asset which takes the price up a little before the bearish trend continues, this causes lower highs in the strong bearish trend. When the supply and demand are equal at some levels, the market would move in range, which is reaccumulation in a bullish trend and redistribution in a bearish trend.
Conclusively, all these market states practically work on the cryptocurrency chart according to Dow theory and I am bold to say that it is highly important in technical analysis.
Question 2
In your own words, explain the psychology behind the Accumulation and Distribution phases of the market. (Screenshots required)
Accumulation and distribution are seen in bullish and bearish trends respectively. We can attribute this to the buying or selling pressure of the asset which prepares the way for new trends, say bullish or bearish. This market phase can be initialized by big investors which gets other traders to join the game as the latter believe a new trend is underway. The psychology behind this market phase is what I will be discussing in the part of the task.
Accumulation phase
There is no new market phase except there has been a prevailing one earlier, a new phase come to play to replace the last one. Heavy market movement in one direction is not possible with little investors it'd rather involve big investors like a big financial institutions to move the market. In a bearish trend of a market when big investors have closed their positions in the market, smaller investors too may close their positions due to the fear of losing money and in some instances, the positions may be force closed due to high volatility.
The big investors have achieved the aim of taking some profits while they open another position towards the bullish direction, this action gets other small investors involved as enough liquidity is being generated to trigger orders, the market of the asset will move in range at the bottom of the bearish trend for some time, this is known as accumulation before the price breaks the range zone to start a bullish trend.
In the new bullish trend, there are levels where the investors will take some profits in the market, and this pause the price movement for some time while other traders enter to create a range movement before a break above the zone occurs to continue the bullish trend, this is known as reaccumulation.
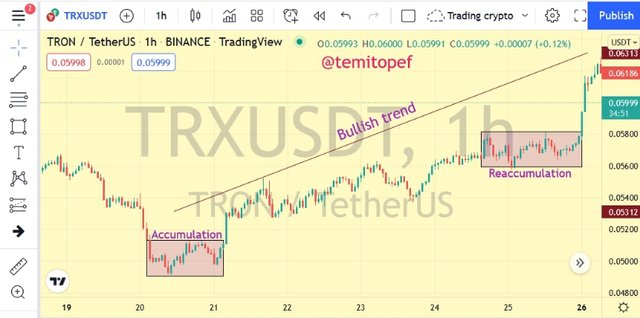
Analysis Image from TradingView
In my practical analysis above after a bearish trend, the market moved in range which can be traced to big investors taking a long position, the market goes bullish as the investors have acquired the necessary liquidity. In the bullish trend, the price movement paused for some time and this can be traced to the actions of investors taking profits from the market while other traders buy more, this is known as reaccumulation, and the bullish trend continued.
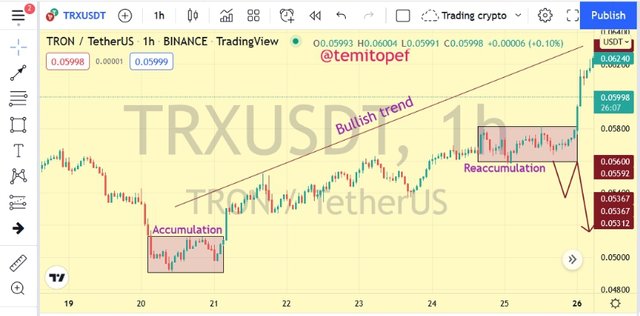
Analysis Image from TradingView
In my practical analysis above, although the bullish trend continued, it's possible that the price could have broken the range zone below, retest the zone which turns it to resistance and the market will go bearish, that could have been a redistribution level that begins a bearish phase.
Distribution Phase
The distribution phase is the one that occurs at the top of a bullish trend, this is the level where big investors that entered the market at the accumulation zone takes profit in the market by closing their positions, they have successfully involved smaller traders in the bullish run and they are taking their profits. This phase pause the bullish move as some other small traders start closing their positions in loss, especially those who entered the trade at the peak of the trend.
The trend becomes trendless (range) for some time before other traders sell more assets and this will break below the range zone for a bearish trend to begin. On the way down, more traders may close their sell positions to take some profits while some buy more and the price would be paused to make a high, this zone is known as redistribution and the price breaks below the range zone again to continue the bearish trend.
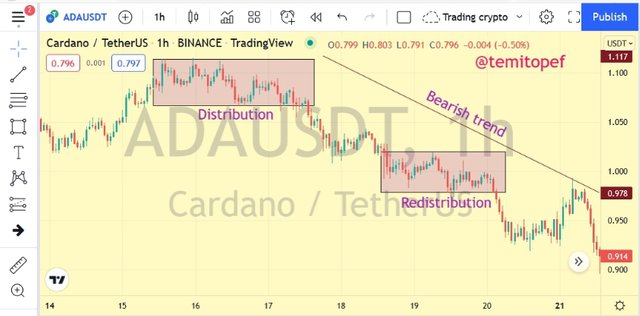
Analysis Image from TradingView
In my practical analysis above after a bullish trend, the market of the asset entered a range phase which can be traced to the big investors who entered at the accumulation level taking profit in the market. Some traders that entered the market lately have their positions displaced in loss, this is known as distribution. Other traders would have started selling to push the market to the bearish trend, on the way down some investors tried to buy some of the assets which take the price up a little, moved in range (redistribution) and the price broke below the zone and the bearish trend continued.
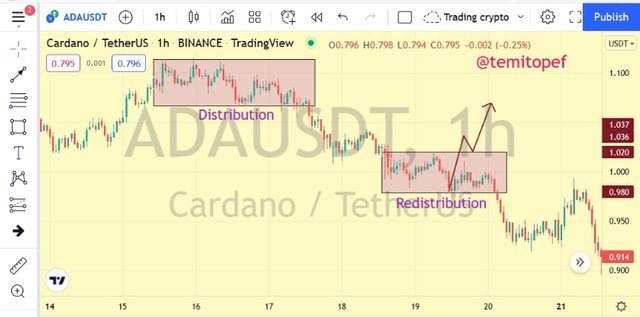
Analysis Image from TradingView
Furthermore, as I have shown above, it's possible that the price can break above the range zone, redistribution. This kind of situation can invalidate the bearish trend that can change the trend to bullish which negates the redistribution phase of the market.
Question 3
Explain the 3 phases of the market and how they can be identified on the chart
There are three phases of the market. A market can either be trending or no trend at all, so the three phases we have are Bullish market, Bearish market and Sideways market. I will be talking about all of it in this section.
To be able to properly identify the phase of a market, it is best to look at the market structure. The market structure shows the analyst what phase of the market is prevailing and shows how strong the phase is before an analyst decides on whether to enter the market in the current phase or wait for a clearer phase. Furthermore, technical indicators can be combined with the identified structure to confirm the phase before entering a market, an example is the volume indicator.
Bullish Market
Bullish market is also known as uptrend market condition and what this means is the price of a cryptocurrency is rising. On a cryptocurrency chart, the candlestick price representation will make increase towards the upward direction which shows an analyst that the market is bullish. Bullish markets allow traders to open long positions in the market to take some profits. For a prevailing strong bullish trend, the price of the cryptocurrency will be making higher highs and lower lows.
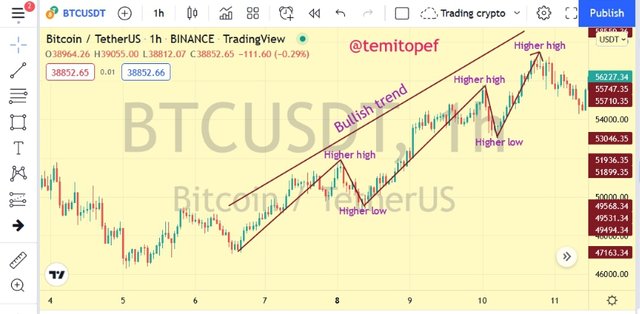
Analysis Image from TradingView
In my practical analysis image above, I identified the market structure in a bullish trend. The trend started with a higher high and a higher low, the trend continued with higher highs and higher lows. This is a structure that shows that the market is a strong bullish trend.
Bearish Market
Bearish market is another phase of the market that means that the value of a cryptocurrency asset is decreasing or we can say the supply of the cryptocurrency asset exceeds the demand of the asset. The market is down in a bearish market, at this phase traders start exiting their long positions and it gives opportunities for others to open short positions to also benefit from the bearish phase of the market. The market structure of the bearish phase can be seen to have lower highs and lower lows, anything of this kind confirms that the phase of the market is bearish.
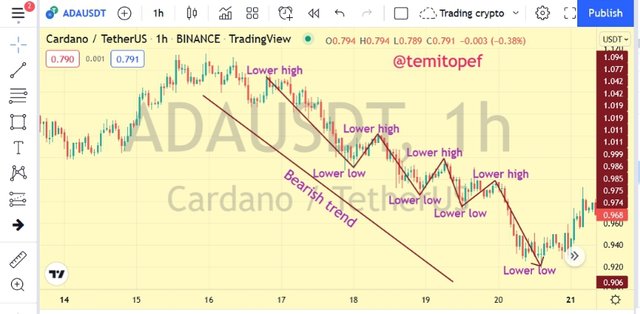
Analysis Image from TradingView
In my practical analysis above on ADA (Cardano), the market phase is bearish and I have identified it with the market structure that started with a lower high and lower low. It was followed by lower highs and lower lows and this market structure tells the analyst that the phase of the market is bearish.
Sideways Market
This is the market phase that is also known as range market or no trend market. This is the phase when the analyst can say the demand of a cryptocurrency asset equals its supply, in that kind of situation the market on the chart can be said to be trend-less, with no movement upward or downward rather sideways. In the sideways market phase, the price will be seen moving between the support and resistance zones. Traders can also use this phase to enter a market using the levels for exit trade in profit and stop loss. The sideways market phase can break above or below to go bullish or bearish.
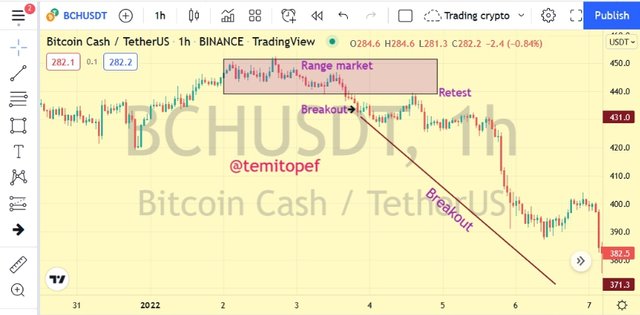
Analysis Image from TradingView
In my practical analysis image above, the market was in a sideways phase where the price is rejected on a resistance level and supported again at a level, the market of the cryptocurrency moved in range for some time before a break below the zone which retested the break again and turned it to resistance then the bearish phase followed as a breakout occurred.
In a prevailing trend, it is possible for the market structure to get broken and the market will go in the opposite trend, this is known as reversal.
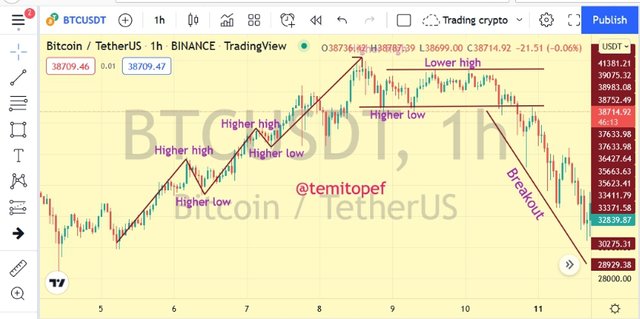
Analysis Image from TradingView
In my practical analysis image above, the market was in a bullish trend with the market structure having higher highs and higher lows, the market changed its direction as a lower high was formed, the market was in range zone for some time and the zone's low was broken to create a lower low, this is a phase change and bearish trend prevailed in the market.
Question 4
Explain the importance of the Volume indicator. How does volume confirm a trend? Do this for the 3 phases of the market (Screenshots required)
Dow theory states that volume would always confirm a trend and that means the volume of trades at a phase of the market has a direct impact on the price of the cryptocurrency asset. At a bullish phase of the market, the volume of buy is high, that is high volatility which shows that the demand for the cryptocurrency is getting concentrated and in a bearish phase of the market, the volume of the sell is high with excess supply of the cryptocurrency asset.
Furthermore, there is a low volume of buying and selling in a sideways market phase where we can say that demand and supply are equal at that zone, low volatility zone. Volume indicator is the quickest technical tool that can be used to easily locate the volume of an asset on the cryptocurrency chart. The volume indicator can be used to confirm the volume of buy/sell at different phases of the market to confirm the phase.
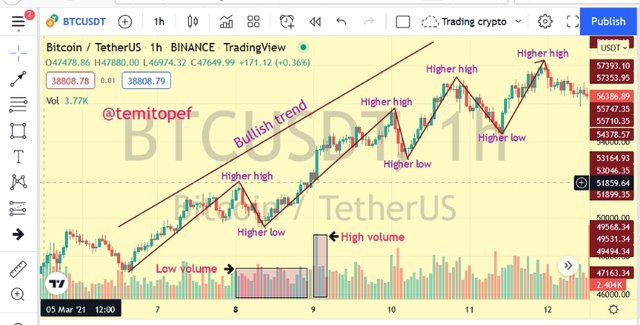
Analysis Image from TradingView
In my practical analysis image above, the market structure has been identified in a bullish market phase and I added the volume indicator to the cryptocurrency chart. The volume showed that there is high volume or high demand concentration at the bullish move of the market, at the retracement trend, the volume is low, and buy and sell volume is almost equal but the impulse trend towards the prevailing bullish trend has high volume, this is also signaled by the volume indicator for the identification of the bullish phase.
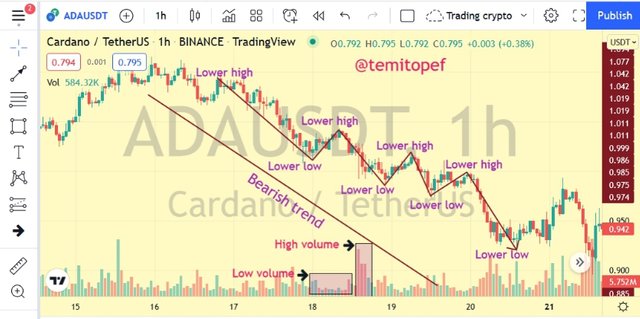
Analysis Image from TradingView
In the analysis chart image above, the volume indicator helped me to confirm the phase after I have drawn my market structure. The volume was high, particularly on the impulse trend which confirms that the bearish trend is true in the cryptocurrency market, even though I had my market structure in place, the volume indicator also serve as confirmation tool for me.
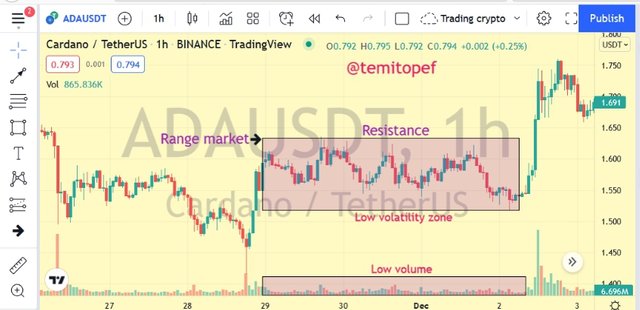
Analysis Image from TradingView
The sideways phase is always a zone of low volatility with a low volume of trade, we can say both volumes of sell and buy is equal here as the price move in range. In my practical analysis image, the market was in a sideways phase and the volume is low as signaled by the volume indicator. Conclusively, a volume indicator is a good confirmation tool of the market phase of a cryptocurrency.
Question 5
Explain the trade criteria for the three phases of the market. (show screenshots)
Bullish Trade Criteria
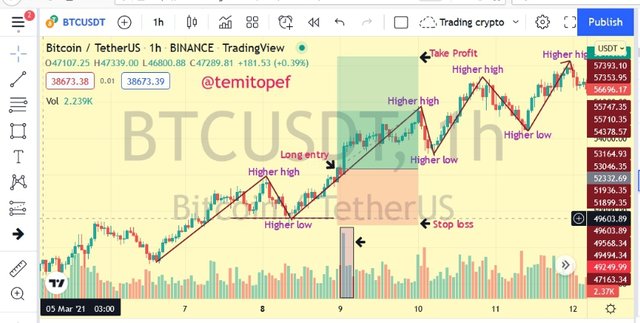
Analysis Image from TradingView
In my chart analysis image above, the phase of the market is bullish and the market structure has been drawn out with higher highs and higher lows. After the retracement trend, a reversal with impulse trend occurred in the way of the bullish trend, I made a long entry after the volume indicator signaled a high volume of buy. I used a 1:2 risk-reward ratio with my stop loss level placed below the recent low formed by the retracement trend.
Bearish Trade Criteria
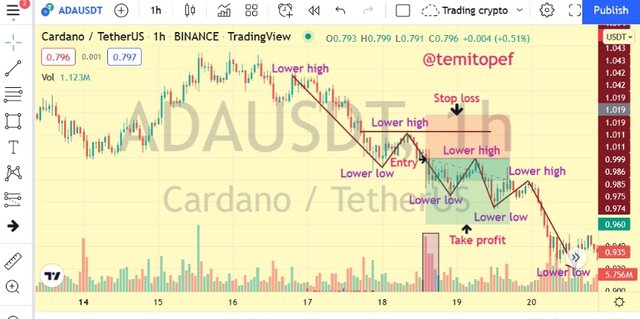
Analysis Image from TradingView
In my practical analysis image above, the bearish phase is the state of the market. I have identified the market structure with lower highs and lower lows. A retracement trend occurred to create a new high, a reversal occurred to form an impulse wave in the direction of the prevailing bearish market. After the reversal, I entered a short position on a bearish candlestick having confirmed a high volume of sell through the volume indicator. My stop loss was placed above the recent high point formed from the retracement trend with the risk-reward ratio of 1:1.5.
Sideways Trade Criteria
Sideways can be easily traded though risky. The support and resistance levels are used for entry and exit.
- The support level is used to enter a long position and the resistance level used for taking profit with stop loss below the support.
- The resistance level is used to enter a short position and the support level is used for making a profit with stop loss placed above the resistance.
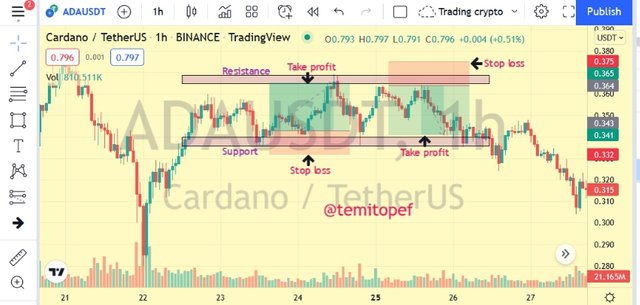
Analysis Image from TradingView
In my practical analysis image above, I have marked long and short positions using the support and resistance levels respectively. My stop loss for the long position was at the bottom of the support zone and for the short position, it was at the top of the resistance zone. The risk-reward ratio of 1:2 was used for both.
Question 6
With the Trade criteria discussed in the previous question, open a demo trade for both Buy/ Sell positions
Long (Buy) Position
In this section of the task given by the professor, I will be executing buy trade. To perform this kind of trade, the market must have been in a bullish phase with clear market structure of higher highs and higher lows, and the move must be supported by the volume indicator.
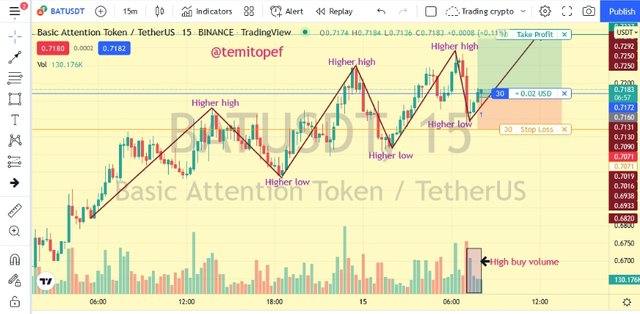
Analysis Image from TradingView
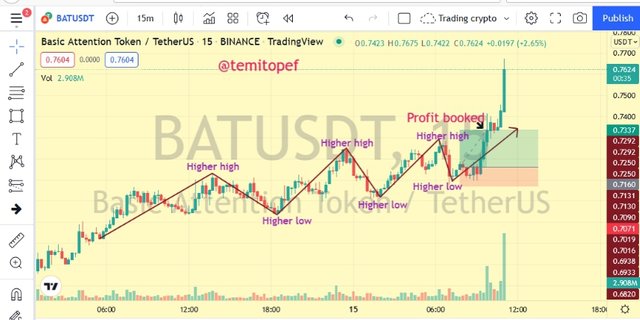
In my practical analysis of BAT (Basic Attention Token) on 15mins time-frame, I have identified a bullish phase of the cryptocurrency market with higher highs and higher lows. Before my entry, a retracement trend created a new low point and the impulse trend started towards bullish, at this level the volume indicator signaled high volume of buy. With these things, I entered a long position with a bullish candlestick at 0.7175 USDT, my exit trade in profit at 0.7337 USDT and stop loss at 0.7071 USDT. My risk-reward ratio is 1:2 and the trade was placed using paper trading on TradingView.
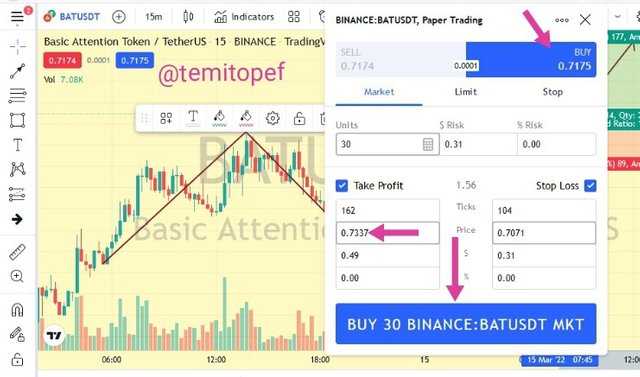
Analysis Image from TradingView
My trade is running on trading paper and I will show it in the trade image below.

Analysis Image from TradingView
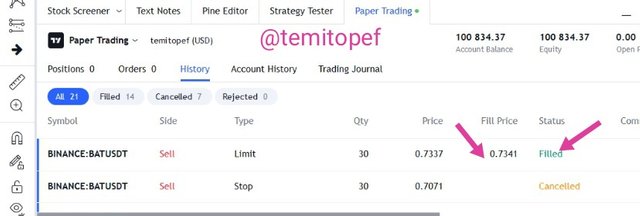
My demo trade on BAT hits the exit trade in profit level that I set during my analysis and this means the trade closed in profit.
Analysis Image from TradingView
Analysis Image from TradingView
Short (Sell) Position
For me to be able to enter a short position, the market must have been in a bearish phase with the market structure of lower highs and lower lows. I will apply the criteria discussed in the last section to place a sell trade as I have identified this market structure in the CAKE market, I love cake and I am trading cake today. That's some jokes though.
Analysis Image from TradingView
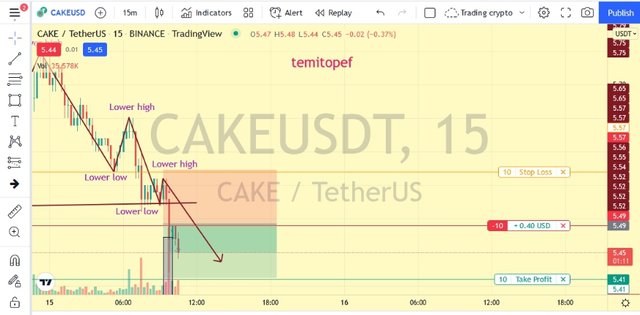
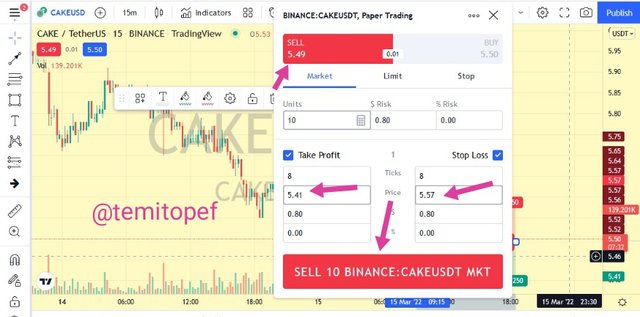
In my practical analysis of CAKE on 15mins time-frame above, the phase of the market is bearish and I have identified the market structure to have lower highs and lower lows. The volume indicator signaled high volume of sell at the impulse trend so I am sure of the bearish phase continuation. I entered a short position at 5.49 USDT on the long bearish candlestick, placed before the analysis image was captured, my exit trade in profit at 5.41 USDT and my stop loss at 5.57 USDT and my risk-reward ratio is 1:1. The position was placed using trading paper on TradingView.
Analysis Image from TradingView
My demo trade is running on paper trading and I will show the trade in the image that will be uploaded below.

Analysis Image from TradingView
This short position also closed in profit as the CAKE market hits my exit trade in profit level. I will share the analysis image below.
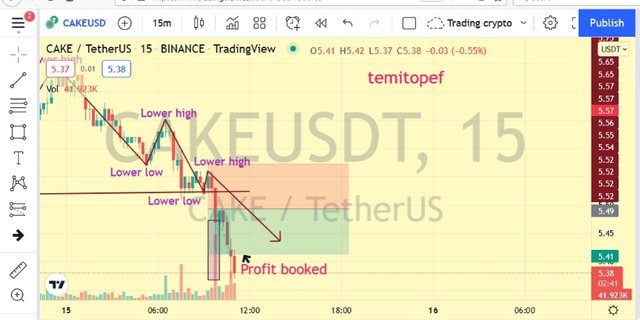
Analysis Image from TradingView
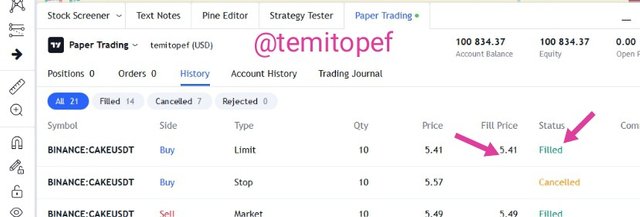
Analysis Image from TradingView
Both my trades closed in profits after the price of BAT and CAKE hits my exit trade in profit levels and the profits are $0.51 and $0.80 respectively.

Analysis Image from TradingView
Conclusion
Dow Jones theory is a very genuine work that has practically been proven in real trading which helps to understand the psychology behind each phase of the market. It's established that a bullish market will have higher highs and higher lows while the bearish market will have lower highs and lower lows, and this continues until there is a trend reversal. The moves of the higher highs, higher lows, lower highs, and lower lows have retracement trend and impulse trend.
One of the aforementioned trends is a retracement of the price which is in the opposite direction of the prevailing trend while the impulse trend continues the trend. Dow Jones theory also establishes that price will always be supported with volume which could be high volatility in trending market phases or low volatility in ranging phase. Conclusively, Dow Jones theory is highly important in technical analysis.
I appreciate the effort of respected professor @reminiscence01 to produce this wonderful lecture in the academy.
Sort: Trending
Loading...