Steem/USDT Scalping – Mastering Short-Term Trading Strategies
Hello everyone, how are you? I hope you are all well and enjoying your lives and learning new things by connecting with Stimmit.Today I am here to master short-term trading strategies in the Steemit Crypto Academy competition. I am participating in a competition to discuss a really interesting topic and we will learn a lot in it. My only goal is that you understand my post correctly and I will try my best to improve myself and I will also try my best to teach you this.
If any of you want to participate in this competition, you can join through this link:
Steemit Crypto Academy Contest / SLC S23W4: Steem/USDT Scalping – Mastering Short-Term Trading Strategies
.png)
So let's start learning and teaching.
Question 1: Scalping Steem/USDT Overview
1. Fundamentals of Scalping
Scalping is a strategy characterized by high frequency trading over very short periods of seconds to minutes, with the aim of profiting from small price movements. Some characteristics are: hyperactive trading style wherein trades are executed constantly throughout the day, numbering in dozens to hundreds of orders each day with the aim of profiting through a very minimal amount ranging from 0.1%-0.45% for every trade. Relies on lower timeframe, such as 1 minute to sometimes even tick charts for orders, for spotting fleeting opportunities. Extensive reliance on indicators such as order book, RSI, MACD, Bollinger Bands for rapid decision making and execution of trades. Very strict measures of loss mitigation and lower bound orders per trade of 0.2 to 0.5 percent to stop loss. Hyperactive abandonment or downloading of the internet.
2. Scalping vs. Day Trading vs. Swing Trading
| Aspect | Scalping | Day Trading | Swing Trading |
|---|---|---|---|
| Timeframe | Seconds to minutes | Hours | Days to weeks |
| Trades/Day | 50–500+ | 1–10 | 1–5/week |
| Profit Goal | Tiny gains (0.1–0.5%) | Moderate gains (1–3%) | Large moves (5–20%+) |
| Analysis | Purely technical | Technical + news | Technical + fundamental |
| Stress Level | Extremely high | High | Moderate |
Key Differences:
Scalpers focus on speed and the number of trades, while day traders focus on the trends of the day.
Swing traders pay greater attention to fundamentals and can therefore hold positions longer (i.e, waiting longer on project updates for Steem).
3. Reasons why Steem/USDT is Good (or Bad) for Scalping
According Factors:
- Volatility:
Due to community events, governance updates, or trends in the cryptocurrency market, Steem has some events that can drastically fluctuate its price, giving other scalping possibilities.
For example, in 5 minutes, a 2% increase in price can occur, which would qualify as a scalping move within that time frame.
- Liquidity:
Steem/USDT usually has enough liquidity at big exchange centers for example, Binance and Huobi, thus having a robust market, which indicates a good supply and demand 0.1–0.3% .
Slippage in the highly liquid markets is reduced, which is important in using the scalping technique.
- Low Fees:
- The cost for transactions is low for Binance, which can be 0.1% or lower, so the chargers for trades won’t be a problem for trade bots.
- 24/7 Market:
- The cryptocurrency markets do not have a closing time which means scalpers can trade as long as there is volatility.
Unsuitability Factors:
Market Noise:
Based on speculative news or low market cap coin volatility, Steem's price can be drastically fluctuating which add false signals.
Example: A tweet out of the blue concerning the Steem ecosystem may cause price movements of 5% in either direction which can be detrimental to scalpers.
Low Liquidity on Smaller Exchanges:
- Lesser known exchanges often have poor liquidity meaning the order books are not filled. This results in wide spreads in Steem/USDT such as 1-2%.
Regulatory Risks:
- There is regulatory unpredictability with regard to cryptocurrencies; a new restriction on exchanges can create strategy turmoil.
Emotional/Physical Demand:
- Discipline and a lot of screen time are needed. For many traders, this is not sustainable which further increases the demand emotionally and physically.
Conclusion
Steem/USDT should be approached with caution when scalping:
Ideal for: Seasoned scalpers who have access to high liquidity exchanges, low fees, and sufficient volatility management tools available.
Avoid if: You are devoid of good execution platforms, risk appetite for sudden price fluctuations, or lack emotional strength.
Tip: Take profitless demo trades to practice Steem/USDT scalping during random periods of high volatility such as when major news concerning crypto comes out.
2️⃣ Question 2: Best Indicators for Scalping Steem/USDT
Scalping is a popular trading technique that seeks profit from minor price changes by buying and selling assets within a short period. Timeframes that traders use in this strategy are very smaller in comparison to others. Traders use indicators and make almost instantaneous decisions. An example of a scalping indicator is the Relatives Strength Index aka RSI. This indicator reveals overbought and oversold conditions and allows traders to take advantage of price reversals.
Understanding RSI for Scalping
The Relatives Strength Index is an indicator that describe a situation of assets price movement in relation to their change in value over a specific time period. It utilizes a measurement between zero and one hundred which acts as a neutral marker, highlighting areas where traders can deem an asset overbought (too costly) or oversold (too cheap).
Key RSI Levels to Watch:
Above 70 → Overbought Zone (May indicate that prices will start to go lower)
Below 30 → Oversold Zone (May indicate that prices will rise)
Between 40-60 → Neutral Zone (There is not enough movement in the market)
To enable the quick selling and buying that scalping requires, traders use a quicker response time on the RSI indicator, opting for the 7 signal versus the 14 default.
Configuring RSI for Scalping in TradingView
To apply RSI for scalping, you must make sure to properly set up the indicator on TradingView. Here is how you can do this:
1️⃣ Go to TradingView, and look for the Steem/USDT chart.
.png)
2️⃣ Switch to a 5 minute (ideal for scalping) timeframe.
.png)
3️⃣ Click on Indicators found at the upper right corner of the chart.
.png)
4️⃣ Look for RSI, then choose the Relative Strength Index indicator.
5️⃣ Click on the Settings ⚙️ icon of RSI.
.png)
6️⃣ Adjust the Length from 14 to 7 (for quicker signals).
.png)
7️⃣ Set the Overbought Level to 70 and Oversold Level to 30.
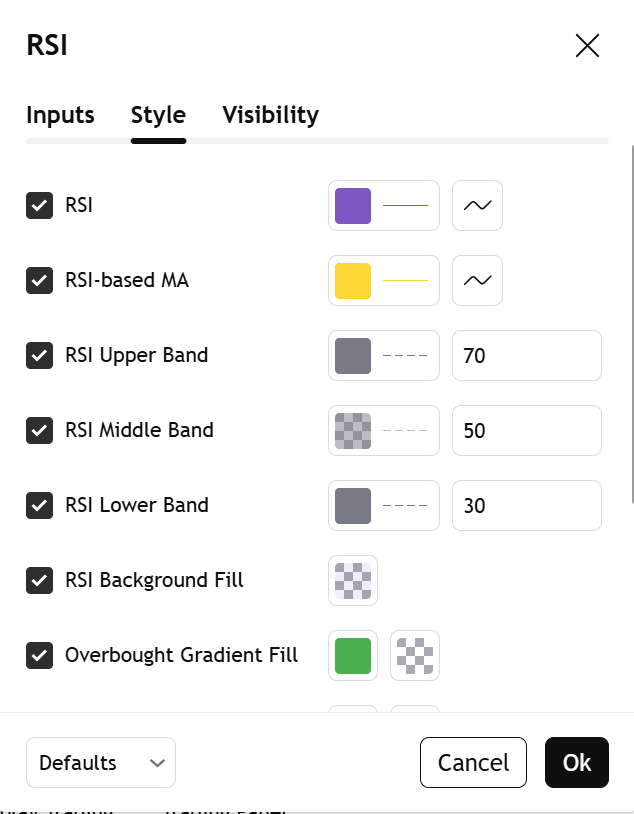
8️⃣ Click OK to confirm the changes.
Your RSI indicator is now ready for scalping!
.png)
The first element of our scalping strategy centers on buying an asset when the market is oversold.
✅ Buy Signal (RSI Below 30)
An RSI reading at 30 or below means an asset is oversold.
This indicates that the selling pressure is enormous, and the price is likely to reverse upwards soon.
A scalping buy entry is best when the RSI starts moving back above 30 after being below 30.
Example Trading Plan:
🔹 Entry: When the RSI goes under 30 look for a small bounce before making the trade.
🔹 Stop-Loss: Set the stop-loss above the most recent lowest price to manage risk.
🔹 Take-Profit: Sell once the RSI sells to 50-60 to gain some profit.
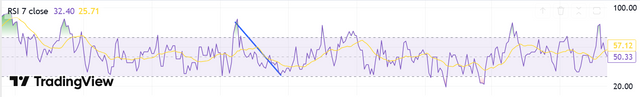
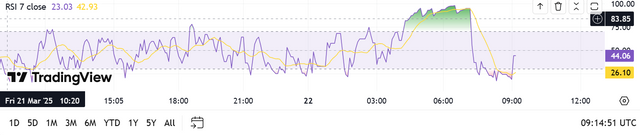
Real Example from the Chart:
RSI had dropped below 30, that would have been a good scalping entry point.
Check confirmation
You are looking at the people inside the blue box on the left side.RSI =26.11
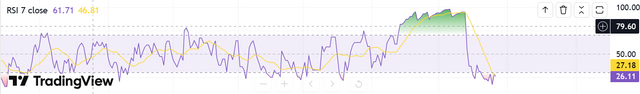
How to Utilize the RSI for Selling (Taking Profit)
Having executed a trade with RSI below 30, we now need to establish an optimal take profit exit point. A trader’s aim should be to make a sale when the price is detected to be overbought or reversal is imminent.
✅ Sell Signal (RSI Above 70)
An increase of the RSI beyond 70 indicates the trading commodity is overbought.
This shows that the demand is high, which indicates that the price may is subjected to a downward reversal.
A scalping sell exit is ideal when RSI starts moving back below 70 after being in the overbought zone.
Step-By-Step Selling Strategy
🔹 Step 1 - Identify Overbought Condition:
Check the RSI figure, if it is marked 70 or above, it indicates overbought situation.
The price might start falling, in that case, get ready to exit.
🔹 Step 2 - Confirm Reversal:
When RSI moves below 70, confirmation for reversal is clear.
Put in place a sell order at this point and enjoy the profits!
🔹 Step 3 - Set Take-Profit Levels:
- You can sell completely when RSI falls below 70.
- OR you can sell in parts:
- First Exit at RSI 60 for quick profit.
- Second Exit at RSI 50 if the price still looks weak.
🔹 Step 4 - Use Stop-Loss for Safety:
- If RSI does not reverse and keeps rising, don’t hold the trade for too long.
- Place a Stop-Loss just above the recent highest price to protect your profits.
Example from the Chart:
.png)
Check Confirmation Entry
Strategic Risk Management Avoiding False Signals
As with any form of trading, scalping for stocks requires decision-making skills. In order to remain profitable, here are some tips for capital protection.
1️⃣ Use Caution While Purchasing on a Downtrend
🚫 Mistake: The price is going down and someone buys when RSI is under 30.
✅ Solution: Only buy if RSI moves back above 30.
2️⃣ Ensure You Don't Sell Too Early
🚫 Mistake: Selling at the first instance when RSI touches 70 irrespective of the price still going up.
✅ Solution: Make sure to sell only after RSI moves lower than 70.
3️⃣ Use Stop-Loss & Take-Profit Features
Stop-Loss: If a trade isn’t going your way, always exit to control losses instead of holding them.
Take-Profit: Avoid being too optimistic and always have a target instead.
Final Scalping Plan (RSI 7 Strategy)
| Step | Condition | Action |
|---|---|---|
| 1 | RSI drops below 30 | Buy (Scalping Entry) |
| 2 | RSI crosses back above 30 | Hold Trade |
| 3 | RSI reaches 60-70 | Prepare to Sell |
| 4 | RSI crosses below 70 | Sell (Exit Trade) |
| 5 | If RSI continues rising | Hold, but place Stop-Loss |
Conclusion: How to use RSI for Consistent Scalping
✅ Change to RSI 7-period for sharper signals.
✅ Starts rising below 30 and buy the RSI.
✅ Sell when RSI is falling above 70.
✅ Avoud chances of unwanted losses with stop loss & take profit.
✅ Better reliability comes from confirming with candlestick patterns and support/resistance levels.
Detailed Trading Method Using Step RSI & EMA 50/200
🔵 Buy Signal: When to Enter a Trade?
✅ Condition 1: The price should be above EMA 50 → Draws a confirmation of an uptrend.
✅ Condition 2: Check the RSI value and it should be below 30 → Clearly shows an oversold condition.
✅ Condition 3: RSI should also move back above 30 → Buyers are clearly confirming they are coming into the market.
Entry Point: The price is higher than EMA 50 and RSI has crossed back above 30 after being below 30.
Stop-Loss: Beyond the most recent swing low to safeguard against dishonest breakouts.
Take-Profit:
- Primary goal 60 on RSI
- Final exit deals with 70 on RSI
Sell Signal – Exiting a Trade
✅ Condition 1: Price is under EMA 50 → Downtrend confirmation.
✅ Condition 2: RSI is above 70 → An RSI level indicating an overbought market.
✅ Condition 3: RSI is under 70 → Signifying market participants are selling.
Exit Point: The combination of an RSI move under 70 after being overbought, AND price being under EMA 50.
Stop-Loss: Placed above the last swing high to minimize risk.
Take-Profit:
First target at RSI 50-60
Exit entirely at RSI 30
Refining the Approach to Avoid False RSI Entry Signals with the Aid of EMA 50/200
Do Not Make This Mistake (Buying During a Downtrend)
Wrong Entry: You purchase the asset once RSI dips below 30.
Problem: The price is sitting below EMA 50 → Strong downtrend.
✅ Better Strategy: Do not enter the trade until an RSI above 30 and a price above EMA 50.
.png)
Check Indicator
Do Not Make This Mistake (Selling Too Late)
Wrong Exit: Revenue at 70, so you sell.
Problem: The price is still above EMA 50 → trying to establish bullish trend.
✅ Better Strategy: Settle for a price once an RSI below 70 and a price below EMA 50.
Final Scalping Plan (RSI + EMA 50/200 Strategy)
| Step | Condition | Action |
|---|---|---|
| 1 | Price above EMA 50 + RSI below 30 | Prepare to Buy |
| 2 | RSI crosses back above 30 | Enter Buy Trade |
| 3 | RSI reaches 60-70 | Prepare to Sell |
| 4 | RSI crosses below 70 + Price below EMA 50 | Exit Trade |
| 5 | EMA 50 above EMA 200 | Confirm Strong Uptrend |
| 6 | EMA 50 below EMA 200 | Confirm Strong Downtrend |
Conclusion: Tips on How to Combine RSI with EMA for Profitable Trades
✅ For determining the short-term trend, check the position of price relative to EMA 50.
✅ To confirm the existence of a strong uptrend or downtrend, check EMA 200.
✅ Go long only when price exceeds EMA 50 and RSI goes back above 30.
✅ Go short only when price is below EMA 50 and RSI goes back below 70.
✅ Check position of price relative to EMAs to avoid false RSI signals.
Using RSI and MACD Together
At times, RSI signals can be issued ahead of time, which can lead to trading blunders. Yet, if we connect MACD with RSI, we will only take trades when the bullish or bearish momentum in the market is actually strong.
What is MACD, and How Does It Work?
MACD means Moving Average Convergence Divergence. This is an indicator of a trend that assists in understanding the strength of the market.
MACD is made up of three major components:
1️⃣ MACD Line: It is the difference of 12-period EMA and 26-period EMA.
2️⃣ Signal Line: A 9-period EMA which is the average of the MACD line.
3️⃣ Histogram: It is the difference of the MACD line and Signal line, which indicates how strong the momentum is.
What Are MACD Signals?
When the MACD line crosses above the Signal line - Bullish (shows a buying opportunity).
When the MACD line crosses below the Signal line - Bearish (shows a selling opportunity).
By doing so we can understand if the momentum is strong or weak, which further helps in trading.
Combining RSI and MACD for Scalping
To maximize precision, let’s apply the RSI along with the MACD in the following manner:
✅ BUY SIGNAL:
RSI rises above 30 (which means coming out of the oversold area).
The MACD shows a bullish crossover which means MACD line rising over Signal line.
The histogram turning positive (strong momentum).
✅ SELL SIGNAL:
RSI falls below 70 (which means coming out of the overbought area).
The MACD shows a bearish crossover which means MACD line dropping under Signal line.
The histogram turning negative (bearish momentum).
While scalping, the most difficult problem is knowing when to close a trade. It is still possible to lose money even if there are perfect entry opportunities because poorly managed Stop-Loss (SL) and Take-Profit (TP) can be detrimental. A disciplined exit strategy helps in protecting capital as well as ensures consistent profits.
In this section, we will learn about:
✔️ Ways to properly set Stop-Loss (SL) to achieve the least amount of losses possible.
✔️ Ways of determining Take-Profit (TP) that enables making the most possible profit.
✔️ The technical levels where SL and TP should be placed.
Familiarizing with Take-Profit and Stop-Loss
Stop-Loss (SL) "SL exit tool": A level of price at which you automatically leave a selected trade in order to reduce losses as much as possible during an unexpected price move.
Take-Profit (TP): A price level where you intend to take profit before incurring a loss depending on how the market is trending.
A lot of novice traders will set no SL or TP in hopes the price can return in their advantage, winning them money essentially for no effort at all. Unfortunately, professional traders stay well aware of market changes and therefore always incorporate a proper SL/TP strategy in order to maintain risk management.
Stop Loss and Take Profit in Scalping - How to Set Them
Both SL and TP for scalping must be set as close as possible due to the short duration of trades which can last between minutes and hours.
✅ BUY TRADE - Stop-Loss & Take-Profit Strategy
1️⃣ Entry Condition:
RSI is increasing and above 30 (leaving oversold conditions).
MACD bullish crossover happening (signal line moves below the MACD line.
2️⃣ Where to Place Stop-Loss (SL)?
Option 1: Right under the previous swing low strongest level

Option 2: 5-10 pips below the entry price depending on the volatility of the market

Option 3: For a fixed SL can be set at 0.3%-0.5% less than entry
That's why I show you a stop loss in my trading view.
.png)
Personal Experience Stop Loss Tip
Stop loss is really a hack and we can save our entire fund from losing it, but before placing a stop loss, I would like to give you a piece of advice: place the stop close a little below the resistance behind the market because the market often goes up through resistance.
By combining RSI and MACD, we can avoid false signals and increase the probability of successful trades in scalping. This method helps in catching the right market trends while minimizing risks.
3️⃣ Deciding on the Take-Profit (TP) placement:
First Target: Profits are taken at the same distance as stop loss to maintain 1:1 Risk-Reward Ratio.
Second Target: If volatility is to the upside, then profits can be taken at the next resistance level.
Trailing Stop: If a trade is profitable and continues to increase in value, move the stop loss to break-even to lock in profits.
SELL TRADE – Risk Management with Stop-Loss and Take-Profit
1️⃣ Entry condition:
RSI is currently under 70 which means the overbought market is starting to cool down.
MACD (MACD has crossed below Signal line)in MACD has a bearish signal.
2️⃣ Where to set Stop-Loss (SL):
Option 1: Set SL above the last swing high of the price.
Option 2: Set SL 5-10 pips above entry price.
Option 3: Fixed SL at 0.3%-0.5% above entry.
.png)
3️⃣ Where to Put Take-Profit (TP)?
First Target: Equal to SL (1:1 Risk-Reward Ratio).
Second Target: Next support level.
Trailing Stop: If price keeps dropping, move SL lower to secure more profit.
Why Stop-Loss & Take-Profit Are Vital For Scalping?
✔️ Capital Protection – Restict a huge loss.
✔️ Emotionless – Decision is taken without panic.
✔️ Profits assure over time – Profits built over time.
TRADING TIP It's never advisable to adjust your SL/TP out of fear or greed, stick to the plan.
Conclusion
In my opinion, the right Stop-Loss & Take-Profit strategy differentiates a gambler from a professional trader. Never forget to track technical levels and risk-reward ratios so you can profit as much as possible.
Bollinger Bands
All scalping strategies require rapid decision making. While price movements can be volatile, Bollinger Bands can be useful for identifying them. They include three interconnected elements:
Middle Band - Moving average that is simple; commonly set to a 20 period.
Upper Band - Middle band + 2 standard deviations.
Lower Band - Middle band - 2 standard deviations.
How are Bollinger Bands Useful for Scalping?
Bollinger Bands allow traders to see volatility, as well as possible entry and exit points. This is how:
✅ Overbought & Oversold Conditions:
Price touching the upper band signals overbought conditions, which means there may be possible short-sell opportunity.
Price touching the lower band signals oversold conditions, which means the market is due for an upward movement. A buy opportunity exists.
✅ Breakout Trading:
Bands that indicate low volatility because they contract (squeeze) often signal an upcoming large movement.
These bands show an accompanying trend and indicate high volatility when they expand.
Scalping requires rapid decision-making, and Bollinger Bands capture short-term price action very well. They contain three principal parts:
Middle Band - A simple moving average (usually 20-period).
Upper Band - The middle band + 2 standard deviations.
Lower Band - The middle band - 2 standard deviations.
How Bollinger Bands Help in Scalping?
Bollinger Bands allow traders to assess volatility and possible levels for entering and exiting trades. Here’s the explaination:
✅ Overbought & Undersold Conditions:
Price is deemed overbought when the price reaches the upper band indicating a potential short-sell opportunity.
Price is deemed oversold when the price reaches the lower band, meaning there’s a potential buy opportunity.
✅ Breakout Trading:
If the bands start contracting (squeezing), it indicates low volatility which suggests that a significant price move is more likely to occur.
If the bands start expanding, it indicates high volatility and an ongoing trend.
Example of a Scalping Strategy: Steem/USDTOpen a long position when price touches the lower Bollinger Band accompanied by the formation of bullish candlestick. Set your stop loss underneath the band.
Open a short position when the price touches the upper Bollinger Band and is accompanied by the formation of bearish candlestick. Set your stop loss above the band.
.png)
3️⃣ Question 3: Developing a Scalping Strategy
Scalping refers to a short-term trading approach with many day trades per each day based on small price movements. It aims to take a profit on a particular asset and make multiple transactions throughout the day. As with any activity, preparation is a requirement, as the best way to prepare is market analysis, as well as establishing entry and exit points while managing your position and risk ratios. The most effective type of analysis is always the fundamental one at least in the context of scalping the Steem/USDT pair.
When scalping on the above currency pair, the best-performing timeframes are always 1-minute (M1), 5-minute (M5), and 15-minute charts (M15). Place technical indicators as they are of utmost importance. Price trend can be determined with exponential moving averages (EMA 9 and EMA 21). Relative Strength Index (RSI) will tell you if the price is going in a specific direction and supports market momentum while indicating overbought or oversold zones. Bollinger Bands (BB) will help track volatility and breakout points along with many other purposes.
In a bullish market, with Steem increasing in value, the optimal buy entry happens when the EMA 9 crosses above EMA 21, RSI Goes above 30 (starts getting out of an oversold zone), and the price touches the lower Bollinger Band and starts to go up. This points to a possible rise, making it a good opportunity to buy.
In a bearish market where Steem value is decreasing, the optimal sell entry occurs when the EMA 9 crosses below EMA 21, RSI drops below 70 (moves out of an overbought zone), and the price touches the upper Bollinger Band and then moves downward. This shows that the price is likely to go lower, thus providing a profitable short-selling opportunity.
When scalping, position sizing is important because the profits and losses come in quick due to minimal price changes. A trader ought to only risk 1-2% of their total capital per trade if they want to manage risk properly. For instance, if you have $1000 in your trading account and decide to risk a maximum of 1% per trade, you should aim to lose no more than $10 per trade. The position size should be calculated by the stop-loss distance to ensure risk management.
Setting a stop-loss guarantees minimum damage as a result of prices changing unexpectedly. When buying, the stop-loss must be set lower than the most recent swing low. When selling, the stop-loss must be set higher than the most recent swing high. An acceptable method for utilizing take-profit is to capture the next nearby support or resistance level while setting a risk-reward ratio of not less than 1:1 or 1:2.
Execution of trades is recommended to be done in a timely manner; traders should be able to use market orders or limit orders to swiftly enter and exit trades. Overtrading is not good, and a trader should have 3-5 trades per session as a maximum limit. Because scalping is a fast form of trading, a trader must control his/her emotions to make sure he/she does not act rashly. Moreover, traders have to make sure they are not riding with major economic news and events since scalping can become more dangerous during volatile periods.
The strategy is best suited to novices; it is advisable to test it on a demo account before risking real money and analyze its performance through backtesting. After the strategy is earning profits continuously, traders can use real money to execute the strategy.
5️⃣ Question 5: Real-World Scalping Case Study
Realistic Steem/USDT Scalping Example
Scalping is a method of trading that focuses on realizing small profits on numerous trades within a short timeframe. Here is an example of a trader scalping Steem/USDT on the Binance exchange at a 5-minute interval with an analysis of the RSI, Bollinger Bands, and Moving Averages.
Strategy and Setup
The trader chooses to scalp Steem/USDT for a 2-hour window within which he hopes to conduct multiple trades. The risk-to-reward ratio is set at 1:1.5 which risks 1% per trade.
Current Price: $0.145
Market Sentiment: Funds are bullish with a lot of momentum.
Indicators Confirmation:
- Bollinger Bands: Price is bouncing from the lower band.
- RSI: Indicator is below 30 meaning it is an oversold market.
- EMA-20: Price has crossed above the moving average; bullish movement confirmed.
Trade Entry:
The trader buys at $0.145
Stop-loss set at $0.143 (1.3% risk)
Take profit target at $0.148 (2% reward)
Trade Execution & Adjustments
🔹 Price Spikes to $0.1475 within 10 Minutes
Instead of waiting for full TP, the trader exits 50% of the position, securing +1.72% profit.
A trailing stop-loss is set at $0.146 for the remaining position.
🔹 Price Retraces to $0.146
- The trailing stop is hit, securing an additional +0.69% profit.
🔹 Market Confirmation for Re-Entry
EMA-20 holds as support, and RSI stays above 50, confirming continued bullish momentum.
The trader re-enters at $0.146, with:
Stop-loss at $0.1445
Take profit at $0.149
Trade Results Summary
| Trade # | Entry Price | Exit Price | Profit/Loss (%) | Notes |
|---|---|---|---|---|
| 1st Trade (50%) | $0.145 | $0.1475 | +1.72% | Partial Take Profit |
| 1st Trade (50%) | $0.145 | $0.146 (TSL) | +0.69% | Secured Profits |
| 2nd Trade | $0.146 | $0.149 | +2.05% | Re-Entry |
🔹 Total Portfolio Growth: 1.5% in 2 hours
Key Takeaways
✅ Quarterly Positioning:
- Closing some positions and implementing trailing stop-loss makes it possible to maximize profits while reducing risk.
✅ Re-Entry for More Profit:
- Confirmation before re-entering guarantees traders the ability to ride trends for extra profits.
✅ Adjustments Confirmation:
- A trade can be confirmed with the help of RSI, Bollinger Bands, and EMA.
✅ Preserving Capital:
- Carrying out a 1% risk per trade helps to protect capital and maximize profits at the same time.
Conclusion
This scalping tactic works to adapt to the market as it makes early profits, confirmation trades, and risk management work for them. Proper planning creates possibilities for higher winning trades induced with losses.
I had a great day today and God willing, your day will also be great. Today I wrote this post. I really found it very interesting and my time passed very quickly. Maybe I started writing this post after fasting and this post was completed at around three or four o'clock. Have a great day. Many prayers from me to you. Thank you for reading and learning.