Repost:Trading using wedge pattern -crypto-academy s5w5 homework post for sachin08


A good day to all steemians and crypto lovers around the world.
It is yet another exciting and educative week in the crypto academy, this week holds a lot of innovative and exciting lectures from intelligent professors in this great community.
Today we will be taking the professor @sachin08 lecture on the different trading patterns. With special concentration on the wedge trading pattern.
Let’s learn and explore..

QUESTIONS

Explain wedge patterns in your own words.
Explain both types of wedges and how to identify them in detail(screenshots required)
Do the breakouts of these wedge patterns produce false signals sometimes? , if yes then explain how Ron filter out this false signals
Show full trade setup using this patterns for both types of wedges ( entry point, take profit, stoploss, breakout)
Conclusion

Q1 EXPLAIN WEDGE PATTERNS IN YOUR OWN WORDS

First of all, What is a wedge pattern ?.
This is simply a price pattern used by technical analysts , it is characterized by two trend lines that must converge at a point , these two lines must be drawn precisely to touch or meet the high and lows in the price chart, either below or above. This lines indicate that highs and lows are either falling or rising
A wedge pattern can simply be defined as a type of pattern that uses two trend lines that will eventually intersect or converge with each other as they advance in their movement.
It simply suggests that the two trend lines must touch each other at a point and at this point a current trend will have to end and a new one will begin. These two trend lines are always drawn distinctively , one below the price and the other above.
These two special lines drawn above and beneath the price levels as discussed above have two distinctive functions , one acts as support and the other resistance.
The trend lines move in a very special way , when we observe it we will always see that there is always a big opening or space at the beginning of the movement of the trend, it then closes as it moves forward , intercepting and converging at a particular point. Here the price eventually breaks out, taking a totally different direction. And we can always say that when this happens or is about to happen , the volume or price of the asset will decrease.
It takes about 4 to 5 weeks for a wedge Pattern to form.
They are three main characteristics of a pattern and they are;
- The converging or intercepting trend lines
- A pattern of declining volume of the asset
- And lastly an eventual breakout from one of the trend lines.

These wedges can only be observed in a trend market and not in a range one. This basically means that a trader can spot this type of trend in both a bullish and bearish market trend.
This results in two different types of wedges and they include ;
- THE RISING
- THE FALLING WEDGE
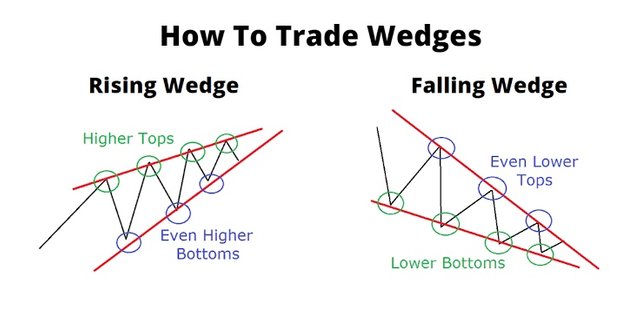
THE RISING WEDGE
In this type of trend , we can observe from the above pictures that the wedge or the two trend lines on the price chart moves in an up direction, then when the price breaks out , a new trend will be formed in the opposite direction.
The two trend lines(support and resistance) that are drawn above and below the price chart pattern can always intercept to provide signals that a technical analyst should anticipate a breakout price reversal.
THE FALLING WEDGE
As the name also implies , it involves movement downwards, that is the two trend lines will continue moving down, and when there is a breakout there is also an obvious reversal in the market chart.
The two trend lines(support and resistance) drawn above the highs and below the lows on the price chart pattern can always intercept as the price will lose its momentum and that’s when buyers step into the market to eventually reduce the rate of price decline.

Q2 EXPLAIN BOTH TYPES OF WEDGES AND HOW TO IDENTIFY THEM IN DETAIL(Screenshots required)

As explained earlier, there are two main types of wedges namely; The rising and falling wedge. In this question I will be analyzing both of them comprehensively.
RISING WEDGE
This type of wedge is associated with the bearish market trend or pattern. This is because the final observable result of this type of trend always ends in a bearish movement in the price of an asset.
As the name implies, the rising trend is a type of trend that involves upward or bullish movement of the price of an asset, after which there is a breakout and it changes its movement to the opposite direction. I.e The trend movement will definitely change from one of upward to downward direction or a bearish direction.
The rising wedge applies the two different trend lines , one acting as support and the other resistance. These two lines advance till they intercept each other at a Particular point, where a breakout will eventually occur causing a movement to the opposite direction. Also the volume or price of the asset will have to reduce.

As shown in the pictures above, it is quite obvious and visible to observe that both the trend lines(support and resistance) meet or touch 2-3 points on the Top and the bottom of the price chart as it advances in its movement, either upwards or downwards.
For a wedge to be correct or reliable it must touch the highs and lows in the price chart.
When we see or notice a possible breakout in a rising wedge it is a clear clue to place a sell entry in order to get profit..
PROCEDURES USED TO IDENTIFY RISING WEDGE PATTERN
First of all, for one to identify a rising wedge Pattern in any market price chart, first of all draw two trend lines , one on top and the other one above.
Secondly we must look to make sure that both the trend lines make contact with the highs and lows on the price chart, the contact must be up to at least 4-5 times(it can always be more than 5 contacts too).
- Lastly one must observe the volume of the asset , when a rising wedge occurs, the volume of a given asset is always expected to decrease.
FALLING WEDGE
There is always a bullish movement in the volume and price of the security . It is the movement of asset prices towards a downward direction or bearish movement. It then eventually encounters a breakout and advances to the opposite direction or bullish direction which is upwards.
The falling wedge also utilizes the support and resistance trend lines, the support and resistance intersection will always instigate a breakout occurrence which will eventually cause a reversal in an opposite direction.
It is also very observable that the price or volume of the asset will always reduce.

As shown in the picture above, it is clear that the trend lines( the support and resistance) touch at least 2-3 points of the price chart(highs and lows).
PROCEDURES USED TO IDENTIFY FALLING WEDGE PATTERN
Just like in the case of the rising wedge, one must draw two trend lines ( the support and the resistance) , one above the price and the other below.
Next one must always be sure and certain that the trend lines make contact with at least 5 points on the highs and lows , in order to be valid.
Lastly we need to look at the volume and price of the assets, as it is expected to reduce.

Q3 DO THE BREAKOUT OF THIS WEDGE PATTERN PRODUCE FALSE SIGNALS SOMETIMES, IF YES THEN EXPLAIN HOW TO FILTER OUT THESE FALSE SIGNALS.

False signals as the name implies are simply wrong signals that are given by the wedge patterns Sometimes when not applied correctly, it can lead to massive loss or mistakes in the market. Although this error can still occur when a trader uses any other pattern of trade.
This justifies my answer , that wedge breakouts sometimes produce wrong signals , but at the same time all these wrong signals can always be filtered out by a method of introducing an indicator.
All modern traders around the world apply indicators to help them filter out correct signals and give them a good chance of gaining profit and at the same time reducing their losses.
Next we will be applying the (Haftrend) indicator , both on the rising and the falling wedge , to see how it aids us in analyzing the signal.
First let’s briefly explain the halftrend indicator,
HALFTREND INDICATOR

Half trend is simply a trading system based on the half trend indicator, this indicator makes use of a triangular moving average channel and trend momentum indicators such as the RSI.
The Half Trend indicator used by technical analysts is an indicator with its main characteristics based on its normal moving averages, it makes precise and accurate calculations in order to get information about the moment there should be a price breakout.
This indicator is very important and useful as it produces a lot of accurate signals for traders in the price market.
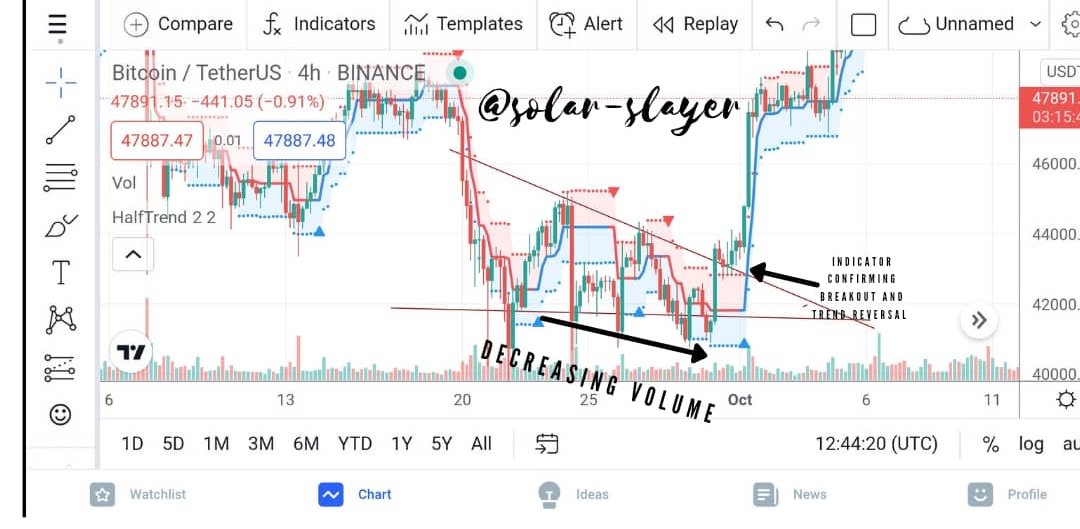

The pictures above show a perfect example. It is symbolized with one line that has multiple colors(2 colors).
These two colors mean two things which are;
The red one simply means a bearish trend in the market and the blue one simply represents a bullish trend.
In some cases it is possible for the pattern to change before the indicator changes, and the reverse is also possible.

Q4 SHOW FULL TRADE SETUP USING THIS PATTERN FOR BOTH TYPES OF WEDGES (Entry point, take profit, stop loss, breakout.)

TRADE SETUP FOR RISING WEDGE
In a situation where there is a rising wedge in the market , a sell entry for traders is usually the case. The simple reason behind this is because the rising wedge advances in an upward direction before it finally converges and breaks out, changing its direction to the opposite direction(downward movement or bearish trend). That is why a sell entry is usually placed when there is a downward movement or trend. This is a pictorial example below ..

The chart above shows us a perfect example of the best time to set up a trade in a rising wedge.
It clearly shows our two trend lines, our breakout position and our entry point , while still not forgetting our stop loss and profit position.
As explained above the volume of the asset should always decrease, and that’s the clear case in the chart above.
TRADE SETUP FOR FALLING WEDGE
During a bearish market traders are on the lookout for a buy entry and this is best useful with a falling wedge. With reasons that the trend or movement of price is always in a downward direction before it breaks out and changes to the opposite direction (upward direction) .

The chart above shows us a perfect example of the best time to set up a trade in a situation of a falling wedge.
From the above picture we can notice a pair of trend lines, a clear entry point, breakout point , stoploss and profit levels .
As also explained above a volume decrease in the volume of assets should always be expected, and that is the case in the above picture.

CONCLUSION

In conclusion, as explained earlier, the wedge pattern is a highly utilized and efficient trading pattern. As explained earlier it is characterized by two different trendlines , they both move in a peculiar way , like an incomplete triangle .
The wedges comprises two types namely, the rising and falling wedge respectively.
And it has also been observed and is advised to use indicators alongside these wedges to filter and clarify their validity to avoid errors E.g Halftrend indicator.
Lastly, I would like to say a very big thank you to the professor in charge of this course @sachin08. I enjoyed every second of it. It was really educational.
Thank you for reading
Add repost in your title.
Done