Steem/USDT Order Book Trading – Mastering Market Liquidity Strategies
Hello everyone! I hope all the members will fine and enjoying your life. Today I am here to participate in the contest of Steemit Crypto Academy SLC S23W5 in this contest we will discuss about Steem/USDT Order Book Trading – Mastering Market Liquidity Strategies, so without wasting our time lets start;
 |
|---|
Question 1: Understanding Steem/USDT Trade Order Book
Steem/USDT or any Crypto pair trading, Order Book is one of the most important tools you should understand about these tools. These tools provides a real-time view of market activity and helps us make more intelligent about trading decisions at the price, where you want to buy and sell.
 |
|---|
The order form is a digital real-time recording of all purchase and sales orders for a particular trading couple in this case Steem/USDT.
Usually includes:
Buy Orders (Bids): This is Offers from traders who want to buy Steem at a specific price.
Sell Orders (Asks): Trader offer, who want to sell Steem at a specific price.
Order Size: The amount of Steem traders want to buy or sell at each price level.
This information is displayed in two columns:
- On the left side (usually green), you'll see buy orders.
- On the right side (usually red), you'll see sell orders.
How Does It Work?
- Placing Orders:
Traders enter buy or sell orders with their desired price and amount.
- Matching Orders:
When a Purchase order matches a sell order at the same price, the transaction is executed automatically.
Example:If someone has a $0.20 order form and another person grants a sales order for $0.20, the transaction will take place immediately.
- Price Movement:
Large buy or sell orders can impact the market price.
- Large buy orders (called a Buy wall) can push the price up.
- Large sell orders (called a Sell wall) can pull the price down.
- Spread:
Spread is difference between the highest bid and the lowest ask is called the Spread. A smaller spread usually indicates better liquidity.
Understanding your order form provides dealers with valuable market insights. Here's the reason:
- Price Transparency:
Buyers and sellers can see where they order and give them a sense of supply and demand in real time
- Liquidity Insight:
The order book depth shows whether you can easily enter or exit positions without causing major price movements.
- Market Sentiment:
Many purchase orders may indicate bullish sentiment, while many sell orders may reflect bearish expectations.
- Better Trade Timing:
The order book helps you place limit orders strategically for example, buying at support levels or selling at resistance.
- Predictive Power:
Large visible orders (also called order walls) may act as future support or resistance levels, helping to predict short-term market moves.
Order Book vs. Traditional Technical Analysis |
|---|
| Feature | Order Book Analysis | Technical Analysis |
|---|---|---|
| Focus | Real-time buy/sell data | Historical price & volume |
| Use Case | Short-term decisions | Trend forecasting |
| View | Live market activity | Chart-based signals |
| Tools | Depth chart, spread, order walls | RSI, MACD, Moving Averages |
| Best For | Scalping, intraday trading | Swing & long-term trading |
Both are powerful, but the order book is extremely useful for immediate insights and short-term trading decisions. For best results, traders often combine both order book data and technical analysis to develop a more complete strategy.

Question 2: Market Depth Analysis and Order Flow
How Deep is the Requirement? |
|---|
Depth Request refers to the amount of buy and sell orders at various price levels that appear in the order book (also known as Level 2 data). This helps traders see how much liquidity is available at any given price, providing a clear view of cryptocurrency offers like Steem and overall market dynamics.
 |
|---|
Deep order books with many orders show high liquidity.
Thin order books suggest low liquidity and possibly more volatile price movements.
 |
|---|
- Support Level:
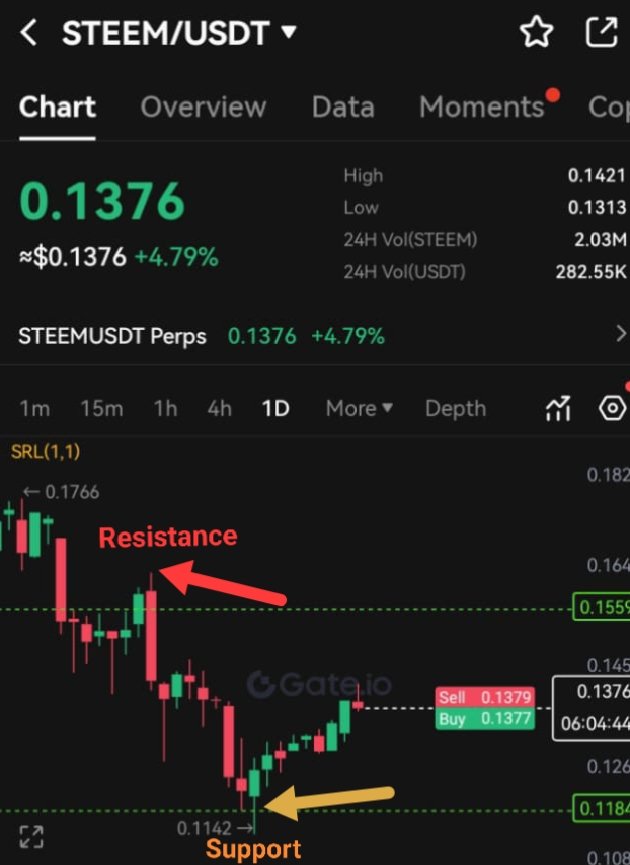
If many purchase orders are abandoned at a certain price level, a **Support Zone**** 0.1142USDT will be created. This means that buyers are interested in entering the market at this price. This makes it difficult to go below the level.
- Resistance Level:
If many sell orders are stacked at a certain level, a resistance zone is 0.1559USDT formed. Sellers are willing to offload their holdings here, making it harder for the price to break through that level.
- Level Strength:
The larger and more consistent volume at a certain level, the more support or resistance you have. These values are often observed by day traders and mesters (Scalpers)for short-term options.
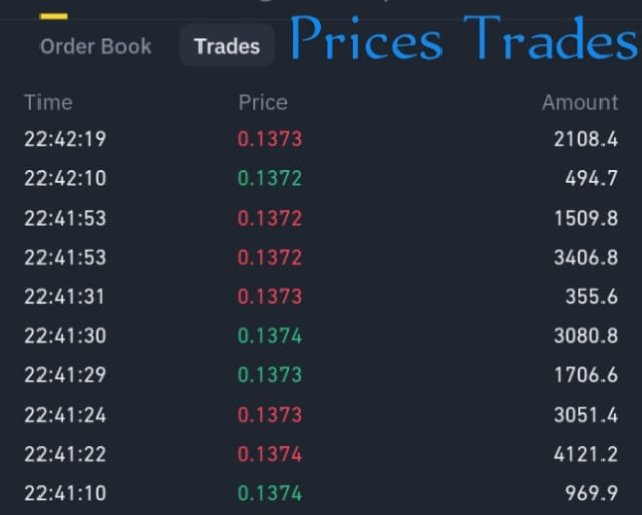
Order flow is the actual movement of market orders in real time. Order flow shows us who is buying or selling and at what price, giving insight into the whole market's momentum and sentiment.
Aggressive Purchases:
When many market buy orders hit the ask (seller liquidity), it shows bullish pressure and may signal a potential upward movement.
- Aggressive Sales:
When market sell orders hit the bid (buyer liquidity), it reflects bearish pressure, possibly leading to a price drop.
Order Imbalance:
A strong imbalance such as significantly more buy orders than sell orders can indicate future movement in that direction. However, hidden large orders can cause sudden reversals.
Absorption:
When large buy/sell orders are absorbed without moving the price much, it suggests strong opposing interest at that level.
Spoofing and Hidden Orders:
Be cautious of large orders that appear and disappear suddenly. This could be spoofing, a manipulation tactic meant to create a false impression of demand or supply. That's why it's important not to rely only on the surface-level order book data.
Why Request Depth and Order Flow Matter |
|---|
These tools give traders a real-time perspective of market sentiment, beyond traditional price charts.
Help detect institutional activity or large players entering/exiting positions.
"Confirming or Rejecting" useful signals from indicators like RSI, MACD, or trend lines.
Extremely valuable for short-term traders, scalpers, and day traders This depends on precise time and fluidity conditions
Understanding and combining depth of requirements and order flow analysis, retailers can develop sharper strategies, reduce risk and recognize opportunities more accurately.
Question 3: Identifying and Reacting to Large Orders?
 |
|---|
 |
|---|
- Large purchase order (whales):
These can demonstrate strong needs. When a large purchase order appears on an order, it often creates a bullish feeling but buyers not purchase in stress 14% that why market feels did not bullish but reversal can possible. Other traders can start in anticipation of upward dynamics, leading to an increase in self-enhancing prices.
- Large sales orders (WAL sales):
These indicate strong sales pressure. Dealers may view this as a potential sign of a price decline and may begin selling the stock. In other words, the market continues to decline. Due to 86% are Sellers more active than buyers that why market shows bearish sentiment
- Iceberg regulations:
Technology used by large dealers to hide the full size of an order. While the rest is hidden, only a small portion can be seen in the order form. This prevents large market responses from being triggered, allowing whales to secretly enter or depart.
- Proximity orders (fake bulk orders):
These are uncooperative orders to manipulate the mood of the market. Dealers may abandon large purchases or sales orders to create illusions of supply or demand only to cancel before execution. This allows emotional dealers to make bad decisions.
A strong concentration of concentration on one side of the order book can cause imbalances. This indicates the occurrence or potential occurrence. Observing this can provide information on the short-term price direction.
 |
|---|
1. Follow the whales (drive trends)
If you have a large purchase or sales order and are constantly running, if you have a large buyer, or if there is a strong selling pressure, we recommend that you match the trend.
2. Avoid falling:
If a big order suddenly disappears, it could be a parody developed to deceive. Always check the residential and market response before plotting.
3. Observe absorption:
If a large sales order is absorbed by the buyers without causing a significant price drop, this indicates strong purchase interest. This can lead to price reversals and the accumulation of intellectual money presence.
4. Use volume and price campaign together:
 |
|---|
Large orders combined with volume mirrors and powerful price transfers usually confirm true interest. Dealers can use this to verify the strength of their movement.
5. Setting strategic stop losses:
Whale activity can cause sudden volatility. It is wise to place protection outage losses beyond the most important support/resistance zone to manage risk.
6. Use warnings and trade equipment:
Many platforms allow you to set up warnings for large shops or sudden changes to the depth of your order book. With these tools, you may be ahead of the market-powered events.
Question 4: Order Book-Based Trading Strategy
Develop a step-by-step order book trading strategy for Steem/USDT, detailing entry and exit points, liquidity considerations, and risk management techniques.
 |
|---|
Order a Steem/USDT Bay Strategy
Order books provide real insight into supply and demand and help dealers to recognize where large buyers or sellers (often whales) are located. By interpreting this data correctly, retailers can make more intelligent decisions. Based on purchase order analysis, the step-by-step trading strategy for STEEM/USDT is shown below.
Step 1: Identify a powerful purchase/sales wall:
Buy the wall:
Large purchase orders at a specific price level act as a support zone. These levels indicate where buyers are willing to collect and often create prices. Sell the wall:
Higher levels of large sales orders act as a zone of resistance. This shows where the seller derives positions and limits the price of upward movements.
Profi Tip: Use the deep power diagram of your order form to visually identify thick order clusters on both sides.
Step 2: Determine market trends based on the purchase order flow
Brick Trends:
If a new purchase wall is added and you dilute the sales wall or move it upwards, this could signal an upward trend. This often shows strong market trust.
Bearish trend:
As sales walls grow and buy or disappear, this may indicate a downward trend will form. Sellers are dominant and are hesitant to buy buyers.
Viewing volume: High purchase or sales pressure in commercial history (time and sales) can check order book signals.
Step 3: Enter your transaction
Buy Entry:
Consider long positions near strong support zones where large purchase orders are stacked. This indicates demand and potential jumps.
Sales Entry:
Find short options near strong resistance levels supported by a considerable sales wall, as they often work as blankets. Eisberg Orders Insight: Some whales hide the size of their order. If small orders are consistently filled out at the same price, it could be an iceberg order. This is a hidden accumulation or distribution strategy.
Step 4: Leave the trade:
Make a profit (TP):
Insert the TP just below the strong resistance level and check the run before stand or inverting.Stop Loss (SL):
Place the SL under entry support to protect against sudden occurrences. Think directly under the last visible purchase wall.
Risk Management Tips: Use a 2:1 or 3:1 risk yield rate to ensure long-term profitability.
Step 5: Adjust your strategy based on market response
- Absorption signal:
Without a significant drop in prices, if a large sales wall is absorbed by an offensive buyer, it can show hidden purchasing power and potential emergence.
- Spoofing and fake walls:
Beware of the large walls that suddenly disappear. These can be false orders for manipulating market psychology. Always check your activities through actual business (about trade history). ---
Step 6: Use Tools and Warnings
With many platforms (such as Binance and TradingView), you can:
Set warnings for a larger look.
Monitor for changes in order reservation depth.
Volume hints and traces of whale movement.
Question 5: Real-World Order Book Case Study
Scenario overview:
At the time of analysis, Steem/USDT was trading at $0.1376. Order books show strong support and resistance levels, providing potential areas for short-term trade.
| Price (USDT) | (STEEM) Buy Volume | (STEEM) Sell Volume |
|---|---|---|
| 0.1379 | 583470.80 | |
| 0.1559 | 527263 | |
| 0.1500 | 8.8M | |
| 0.1376 | Market Price | Market Price |
| 0.1142 | 7.26M | |
| 0.1100 | 600,000 |
 |
|---|
Order Book Snapshot:
Support Zone: $0.1136
Resistance Zone: $0.15
Abnormal: 0.20 USD giant merchant (Goliath's efforts)
Dealer Plan:
Buy support nearby: Buy around 0.11 USD in hoping for a jump.
Local Sales: Sell target orders close to $0.15 to block profits.
What happened? Steem's large, unexpected purchase order of 4,265,504 was $0.20, well above the current market price.
This showed a strong bullish atmosphere, which increased price pressure when other traders joined.
Dealer adjustments:
The dealer moved the purchase order to $0.1379 and adapted to the new dynamics.
They kept the orders at $0.15 and, in the original plan, they were able to make a profit that was close to resistance.
 |
|---|
Most important snacks:
1. Beware of market depression: Large orders with unusual price levels can quickly change the dynamics.
2. Psychology Issues: FOMO has raised prices, causing a huge order of USD 0.20 (packaging horror).
3. Stay flexible: Dealers quickly adjusted their strategy, rather than waiting for ideal entries that might not come. 4. Stick to the profit zone: Even with adjustments, the risk reward ratio stays healthy near resistance.

Conclusion
In this post, we have explored about the Steem/USDT Order Book and how it works as a powerful tool for traders. From understanding the basic structure of the order book to analyzing market depth, identifying large whale orders, and implementing real-world trading strategies. Each section provides a important insight into learning short-term trading.
Key Takeaways include:
Order Book learning helps identify live support/resistance levels and real-time understanding of market sentiment.
Market depth and order flows provide deeper insight into the liquidity and hidden intentions behind large trades.
Recognizing Whale Activity allows traders to react intelligently and adapt their strategies.
Order purchased Based Strategy ensures better entry and exit planning with defined risk management.
Real-World Case Study shows how flexible strategies based on religious book dynamics can lead to better decision-making and profitability.
Now this is end of my post, I hope you really like my effort and thanks for reading and reviewing my post. At end I would like invite my friends @faran-nabeel, @suboohi, @munazamalik and @sitaraindaryas to participate in this contest.
Regards,
Abdul Sameer