Mastering Steem Market Volatility Using Bollinger Bands
 |
|---|
Greetings friends and welcome to class, this week's topic of discussion from this amiable community is the Mastery of Steem Market Volatility Using Bollinger Bands. Hope you get to learn something new today as I attend to the hints as provided.
Explain the Components of Bollinger Bands |
|---|
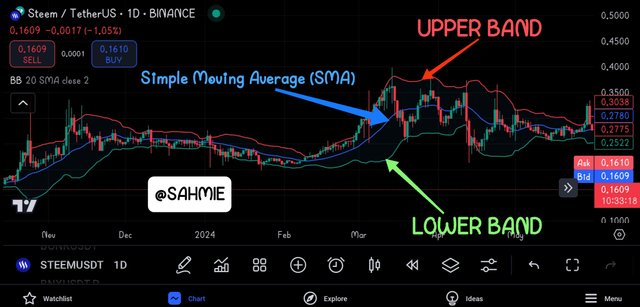
Bollinger Bands are a useful technical analysis tool in trading financial market be it crypto, stock or Forex as they help traders to understand how an asset's price is behaving over time. Therefore understanding how Bollinger Bands work is very important , however these bands are made of three main components which are;
Simple Moving Average (SMA):
The Simple Moving Average (SMA) is known as the average price of an asset over a set period, let's say 20 days, but then you can set the number of days you want. Where this average is gotten by adding up the closing prices of the asset for the last 20 days and then divided by 20. This average is important as it helps smooth out price fluctuations and give users a clearer picture of the asset's trend. Hence, if the Asset's price is above the SMA, it might indicate the asset is on an upward trend, while being below could suggest a downward trend.
Upper Band:
The upper band of a Bollinger Bands is likened to a ceiling for the asset's price. It is said to be calculated by taking the SMA and adding two times the standard deviation of the asset's price over the same period. Why add the Standard Deviation (SD)? Well, I learnt that the standard deviation tends to measure how much the price varies from the average price. So, if the upper band is high, it means that the asset has been trading at higher prices than usual, which can signal that it might be overbought. Hence, at the point traders often see it as time to sell.
Lower Band:
The lower band on the other hand acts as the floor for the asset's price. Like the Upper Band, it involves the Standard Deviation, however it is calculated by subtracting two times the standard deviation from the SMA. Therefore, if the lower band is low, it tends to indicate that the asset has been trading at lower prices than usual, which can suggest it might be oversold, making it a potential buying opportunity for traders if they believe the price will rise again.
 |
|---|
Now that we've known each component of Bollinger Bands, how does each of them contribute to understanding market volatility and making trading decisions? Well, each component plays an important role in helping traders understand market volatility and make informed trading decisions in the following ways;
Simple Moving Average (SMA):
The SMA acts as a reference point for the asset's average price over a specific period, so when traders look at the SMA, they can see the general direction of the asset's price. Therefore, if the price is consistently above the SMA, it is an indication of a strong upward trend, suggesting that it might be a good time to buy. However, if the price is below the SMA, it could indicate a downward trend, which may prompt traders to consider selling.
Upper Band:
The upper band helps traders to checkmate when an asset might be overbought, i.e., if the asset price touches or exceeds the upper band, it suggests that the price has risen significantly compared to its average, signaling that the asset may be due for a correction, meaning it might drop in price soon. Therefore, traders might decide to sell or take profits when they see the price approaching this upper limit.
Lower Band:
The lower band serves as an indicator of when an asset is being oversold, I.e., if the asset price falls to or below the lower band, it suggests that the price is significantly lower than its average, which could present a buying opportunity for traders. Therefore, traders often interpret this as a chance to buy the asset at a lower price, anticipating that it will bounce back up toward the SMA.
Analyzing Market Conditions with Bollinger Bands |
|---|
To determine if the market is in an overbought, oversold, or neutral state when using the Bollinger Bands indicator, we look at how prices are behaving compared to their historical data. Therefore, to consider if an asset is being Overbought, Oversold or Neutral, the following are looked at.
OVERBOUGHT:
 |
|---|
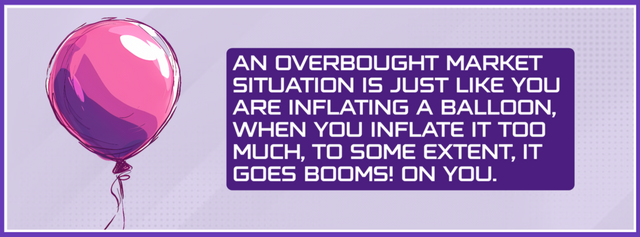
When a market is considered to be overbought, it means that prices have risen too quickly and are higher than what is considered normal or sustainable and this often happens when there is a lot of buying pressure, as investors might be getting a bit too excited about the asset. Therefore, it is considered a risk that prices could soon drop because they have gone up too much and too fast. Just think of it like a balloon that has been inflated too much, that's right, could pop.
OVERSOLD:
On the other hand, when the market is oversold, it means that prices have dropped significantly and are lower than what is seen as normal, and this usually signifies that there is a lot of selling pressure, and investors might be panicking or losing confidence in the asset. Therefore, there is a chance that the price could bounce back up because it has fallen too far. A good example would be a rubber band that has been stretched too much; when you let go, it just snaps back.
NEUTRAL:
A neutral state means that prices are neither too high nor too low, just in a balanced position. Indicating that the market is stable, and there is no extreme buying or selling pressure. In this state, prices can move up or down based on new information or changes in market sentiment, but there is no immediate signal that they are likely to swing dramatically in one direction.
Therefore, when analysing market conditions to buy or sell traders tends to pay attention to two specific conditions, which are;
Price Touching Upper Band:
If the price reaches or exceeds the upper band, it often means that the stock is overbought, which could be a sign for you to consider selling because the price might soon drop back down.
Price Touching Lower Band:
Lastly, if the price hits or drops below the lower band, it also suggests that the stock is being oversold. Therefore you might see this as an opportunity to buy, expecting the price to rise back toward the average.
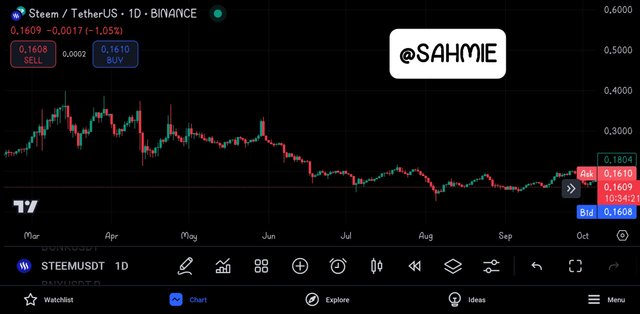
Seeing the different pattern and analysis, let us take a look at the STEEM/USDT historical data below and do some practical analysis.
 |
|---|
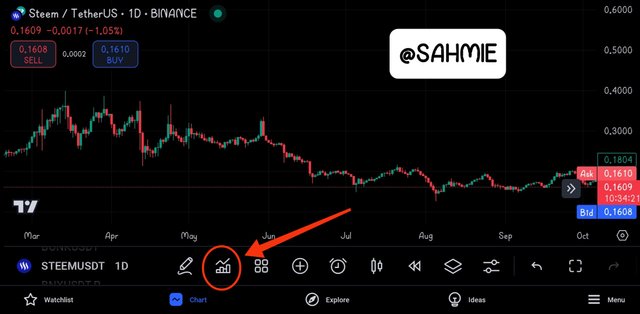
To add the Bollinger Bands indicator to the chat and carry out the analysis, just click on the indicators icon as shown below.
 |
|---|
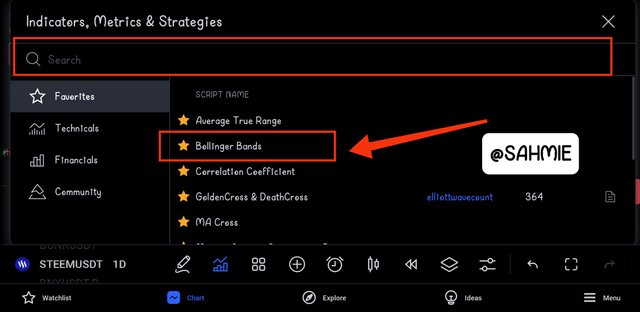
Then on the search bar, you can search for Bollinger Bands for first time users, however since it's on my favourites list, I just click on it as shown below.
 |
|---|
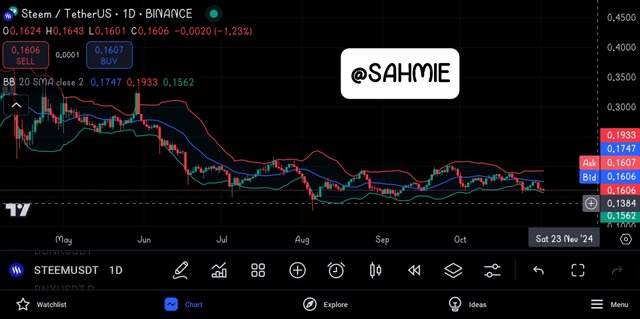
Once the Bollinger Bands indicator is selected, it is going to be applied to the chart as shown below;
 |
|---|
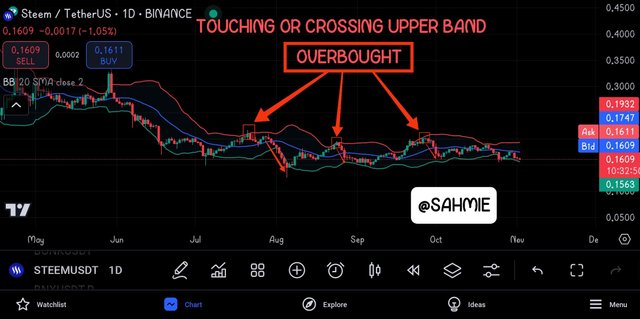
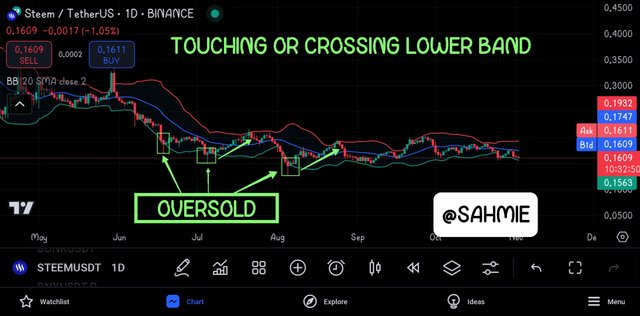
Therefore, with the Bollinger Bands applied to our chart, we can now confidently pick out our overbought or oversold position as shown below;
Remember when the price hits or crosses above the Upper Band, the asset is said to be in an overbought situation signaling that it's time to take profit or sell (selling opportunity), hence below are some of the positions STEEM token was overbought.
 |
|---|
Other the other hand, when the price hits or crosses below the Lower Band, the asset is said to be in an oversold situation signaling that it's time to invest or buy (buy opportunity), hence below are some of the positions STEEM token was overbought.
 |
|---|
Identifying Volatility Patterns with Bollinger Bands |
|---|
Bollinger Bands indicate market volatility by showing how much the price of an asset is moving around over a period of time and this is showing in Bollinger Bands in ways such as;
Wide Bands:
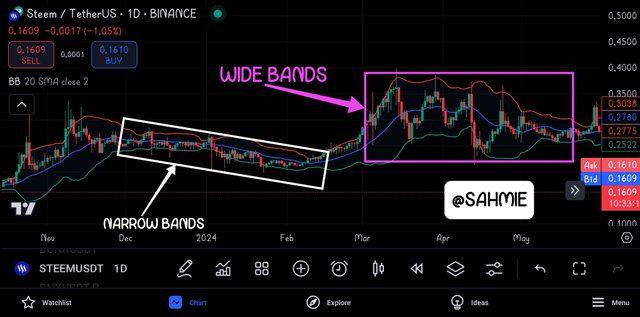
When the Bollinger Bands are spread out far apart, this tends to indicate high volatility in the market, which means that prices are swinging up and down a lot. This therefore signals that there are big price movements happening, which may present opportunities to make profits. However, it also means there’s a higher risk, as prices can change quickly.
Narrow Bands:
On the other hand, when the bands are closely packed together it indicates low volatility, which suggests that prices are stable and not making big leaps. Hence, in this situation, traders tend to be cautious, as it also means that a breakout is coming, either up or down. Hence, as a trader you might want to wait and see which direction the price will go before making any trades.
Adjusting to Price Movements:
The bands adjust based on how much the price is moving. If there is a lot of price action, the bands expand to accommodate the movement, and if the price is quiet, the bands contract. This dynamic nature helps traders cross check the current market conditions.
With all said, let us now look at the STEEM/USDT historical data below and identify this conditions.
 |
|---|
From the above screenshot, it's clear to see how the STEEM/USDT pair formed a Narrow (contracted) band from late November last year till March this year, signaling stability in price. Then from March 2024 to early May showed Wide (expanded) Bands, indicating bigger fluctuations in the price of STEEM.
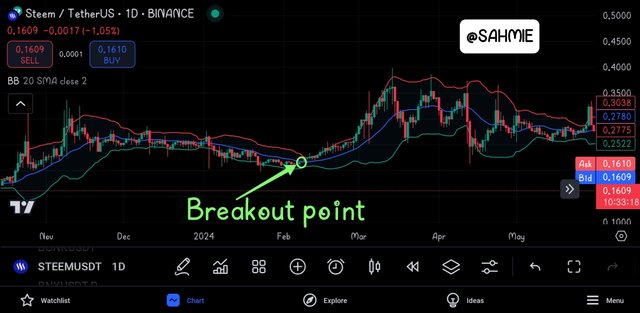
Remember, earlier it was stated that narrow bands usually comes with the fear of a breakout. Looking at the screenshot above, we can see that towards the ending of the narrow bands, there was the sign of a breakout at earlier February where the price of STEEM went above the SMA after struggling for a while to cross it, signaling an upward trend coming as shown below;
 |
|---|
Developing a Trading Strategy with Bollinger Bands |
|---|
Below I present a simple trading strategy using Bollinger Bands for the Steem token, focusing on entry and exit points based on how the price interacts with the bands:
Buying Signal:
Look for the price to touch or go below the lower Bollinger Band. This suggests that the Steem token might be oversold, and it could be a good time to buy. You can enter the trade when the price bounces back up from the lower band.
Confirmation:
To strengthen your buying decision, watch for the price to cross above the middle line (the simple moving average). This shows that the momentum is shifting upwards.
Selling Signal:
When the price reaches or exceeds the upper Bollinger Band, it indicates that the token might be overbought. This is a signal to consider selling your position.
Confirmation:
If the price then crosses back below the middle line, it further confirms that the upward momentum is fading, reinforcing your decision to exit the trade.
Stop-Loss Orders:
To protect your investment, set a stop-loss order just below the lower band when you enter a buy trade. This way, if the price continues to drop, you limit your losses.
Take Profit:
Similarly, when you sell at the upper band, you can set a take-profit order slightly below the upper band to secure your gains before any potential reversal.
By following this strategy, we can make informed trading decisions based on the behavior of the Steem token relative to the Bollinger Bands, helping us navigate the market more effectively.
Predicting Price Movements with Bollinger Bands |
|---|
Bollinger Bands are really helpful in understanding potential support and resistance levels, which are key concepts in predicting price behavior for assets like Steem. Therefore, here is how we can use the positions and movements of the bands to give us insights on them.
Understanding Support and Resistance:
Support levels are prices where a stock tends to stop falling and may bounce back up, while resistance levels are prices where a stock tends to stop rising and may drop back down. Bollinger Bands help identify these levels by showing where the price has historically reacted.
Upper Band as Resistance:
When the price of Steem approaches the upper band, it often indicates a resistance level. If the price hits this upper band multiple times without breaking through, it suggests that sellers are stepping in, making it harder for the price to go higher. Traders might see this as a signal to sell or take profits, anticipating that the price might drop back down.
Lower Band as Support:
On the other hand, when the price approaches the lower band, it usually indicates a support level. So if the price touches this lower band and then starts to rise again, it suggests that buyers are entering the market, believing the price is low enough to warrant buying. This can lead to a price bounce back up.
Therefore, by observing where the price is relative to the Bollinger Bands, we can predict potential price behavior for Steem token. Now look at the screenshot below;
 |
|---|
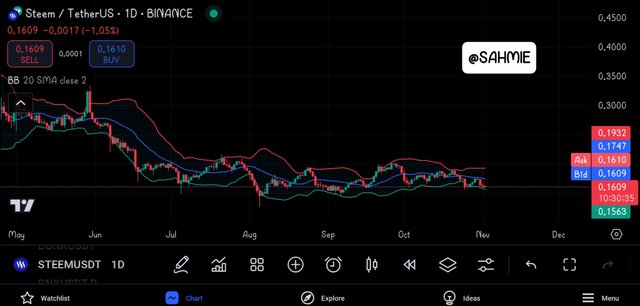
From the above screenshot, we can see that STEEM is currently on a formation of narrow bands, indicating that there is not much price movements, however it is at the oversold position indicating a good time to buy, but with Narrow Bands comes with the fear of a breakout, hence its advised to be cautious.
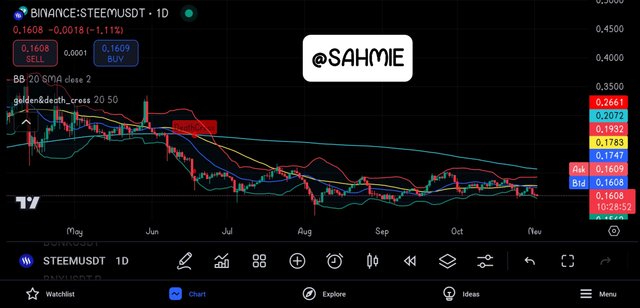
But since the current price is below the SMA and at the oversold position, we can expect an upward trend, and to confirm this prediction I added the Golden and Death cross indicator to the chat as shown below;
 |
|---|
This tends to confirm the upward trend as the smaller SMA is having an upward movement. Hence I can invest in STEEM but using the Upper band range as my resistance level to set my take profit at that point. And the lowest band level as my support level hence place a Stop-Loss a little lower than that point to manage my risk and avoid fake out also.
DISCLAIMER: Everything on this publication is not in any way a trading advice but just a piece of my understanding for learning purposes.
- REFERENCES
- deriv.com
- hmarkets.com
- investopedia.com
- babypips.com
CONCLUSION |
In conclusion, mastering the market with Bollinger Bands is all about looking at past price actions with the help of a friend in Bollinger Band indicator to predict the conditions of the market and what the next action will be like.
I wish to invite @starrchris, @bossj23, @ngoenyi, and @ruthjoe.
Thank You for your Time
NOTE: Always have a smile on your face, as you are never fully dressed without one.

Upvoted! Thank you for supporting witness @jswit.