Advanced Technical Analysis with Divergence Trading
 |
|---|
Greetings and welcome to another wonderful class, this week's topic is settled around understanding the technicality of Divergence Trading. Like always, I hope you get to learn something new as I attend to the hints as provided.
Explain the Concept of Divergence in Trading |
|---|
Divergence, in simple terms, refers to a situation where two things that are supposed to move together start to move apart. In the context of finance and trading, it is often used to describe a discrepancy between the price of an asset (like a stock or cryptocurrency) and an indicator, such as an oscillator (like the Relative Strength Index or MACD).
 |
|---|
For example, if the price of an asset is going up, but the oscillator is going down, that’s called bearish divergence, which might suggest that the upward price movement is losing strength and could reverse. And also, if the price is going down while the oscillator is going up, that’s bullish divergence, indicating that the downward trend might be weakening and a price increase could be on the horizon.
Therefore, divergence is a concept that helps traders to identify potential reversals in the price of an asset, like Stocks or Cryptocurrencies, as it occurs when the price of an asset is moving in one direction while an indicator (like the Relative Strength Index or RSI) is moving in the opposite direction. This can signal that the current trend may be losing strength and could change soon.
Think of it like a person running up a hill, but then, as the person is getting tired and slowing down, the hill continues to get steeper. Hence, the runner (the price) is struggling to keep up with the incline (the indicator). Eventually, the runner might stop or fall back, just like the price might reverse direction.
Divergence therefore is all about helping traders spot potential changes in the direction of an asset's price. This can be seen when the price of an asset and an indicator (like the Relative Strength Index or MACD) move in different directions. This difference (diverse) can signal that the current trend may be weakening or about to reverse.
Basically, there are two main types of divergence, which are regular divergence and hidden divergence.
Regular Divergence:
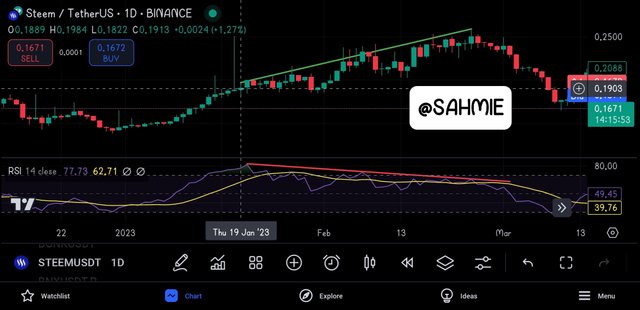
This type occurs when the price makes a new high or low, but the indicator does not. For example, if an asset's price is reaching new highs, but the RSI is making lower highs (I.e each time the price rises, it doesn't reach as high as it did before. So, the highest points are getting lower), this is a sign that the upward momentum is weakening. Therefore, traders see this as a potential signal that the price might reverse and start to go down.
 |
|---|
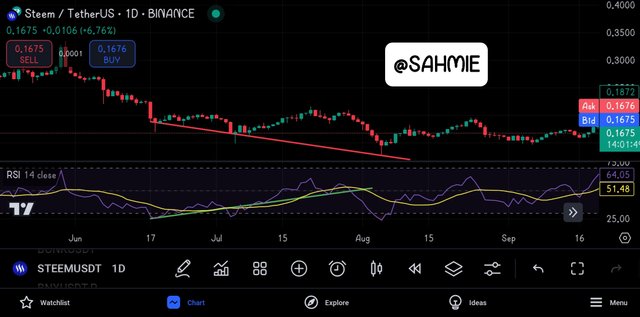
Similarly, if the price hits new lows but the indicator is making higher lows (I.e. each time the price drops, it doesn't go as low as it did before. So, the lowest points are getting higher over time), it suggests that the downward momentum is fading, indicating a possible upward reversal.
 |
|---|
Hidden Divergence:
The Hidden Divergence is said to occur when the price of the asset makes a new high or low, indicating a strong trend, whereas the divergence indicators (like RSI and MACD) fail to make a new high or low, showing that the momentum is weakening. Therefore hidden divergence occurs when the price of an asset is moving in one direction, but an indicator (like RSI or MACD) is moving in the opposite direction.
For instance, if an asset's price makes a higher low but the RSI makes a lower low, it indicates that the price could continue in its current trend (in this case, an upward trend). Hidden divergence is often seen as a continuation signal, suggesting that the existing trend is likely to persist.
To cut short the long explanations, here is a brief explanation of each type of divergence and how they relate to potential reversals or trend continuations.
| Type | What it is about | It significance |
|---|---|---|
| Regular Divergence | This occurs when the price of an asset reaches a new high or low, but the indicator (like RSI or MACD) does not follow suit. For example, if an asset's price hits a new high but the RSI shows a lower high. | Regular divergence is significant because it indicates that the momentum behind the price movement is weakening. If the price keeps rising but the indicator shows weakness, it suggests that the buying pressure is fading. This can signal a potential reversal, meaning the price might start to go down soon. Therefore, traders look for this as a warning sign that it might be time to sell or to be cautious about entering new positions. |
| Hidden Divergence | This occurs when the price makes a higher low or a lower high, while the indicator shows the opposite. For instance, if a stock's price makes a higher low but the RSI makes a lower low. | Hidden divergence is crucial because it suggests that the current trend is likely to continue. In the case of a higher low in price with a lower low in the indicator, it indicates that even though there might be a short-term pullback, the overall upward trend is still strong. Therefore traders interpret this as a signal to buy, as it suggests that the price is likely to keep rising. |
Here are some differences between regular and hidden divergence.
| Function | Regular Divergence | Hidden Divergence |
|---|---|---|
| Price Movement | The price makes a new high or low, while the indicator does the opposite. | The price makes a higher low or lower high, while the indicator does the opposite. |
| Trend Indication | It usually signals that the current trend might be ending and a reversal could happen. | It suggests that the current trend is strong and likely to continue. |
| Use in Trading | Traders look for this to decide when to sell or exit a position. | Traders look for this to decide when to buy or stay in a position. |
Identifying Divergence with the RSI or MACD |
|---|
Before we can identify divergence with the RSI or MACD indicator, we need to know how we can make use of these indicators properly. For these reasons, here is a link to understanding what this indicators are, how to use them and how to apply them to your chart.
Therefore , to identify divergence using the Relative Strength Index (RSI) or the Moving Average Convergence Divergence (MACD), you need to follow these simple steps:
First, look at the price chart of the asset you’re interested in. Check for points where the price is making higher highs or lower lows.
Next, look at the RSI indicator, which is usually displayed below the price chart. If the price is making higher highs but the RSI is making lower highs, that’s called regular divergence. It suggests that the upward momentum might be weakening.
 |
|---|
Conversely, if the price is making lower lows but the RSI is making higher lows, that’s a hidden divergence. It indicates that despite the price dropping, the momentum is still strong, and the price might bounce back up.
 |
|---|
Start by observing the price action on the chart. Again, look for higher highs or lower lows in the price.
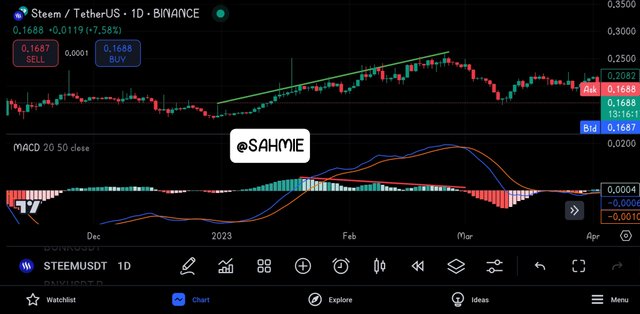
Now, check the MACD indicator, which consists of two lines (the MACD line and the signal line) and a histogram. If the price is making higher highs while the MACD is making lower highs, that’s regular divergence, signaling a potential reversal.
 |
|---|
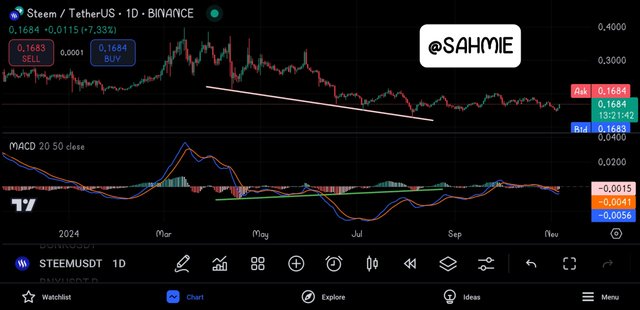
If the price is making lower lows but the MACD is making higher lows, that’s hidden divergence, indicating that the current downtrend might soon reverse.
 |
|---|
Divergence can play a crucial role in informing trading decisions by providing insights into potential price movements. They help traders in various ways such;
Identifying Potential Reversals:
When traders notice regular divergence, where the price is making new highs but the RSI or MACD is not, it signals that the upward momentum is weakening. This is a warning sign that the price might soon reverse. For instance, if a trader sees this pattern, they might decide to sell their position or avoid buying more, anticipating a price drop. This could help them lock in profits before a downturn.
Confirming Trend Continuation:
On the other hand, hidden divergence can indicate that the current trend is still strong. If the price is making lower lows while the RSI or MACD shows higher lows, it suggests that despite the price decline, there’s still buying pressure. A trader noticing this might choose to buy, believing that the price will bounce back up. This can be an opportunity to enter the market at a lower price before the trend resumes.
Combining with Other Indicators:
Traders often use divergence in conjunction with other indicators or analysis methods. For example, if a trader sees both divergence and a bullish candlestick pattern, they might feel more confident in making a buy decision. This combination enhances the reliability of their trading strategy.
Combining Divergence with Other Indicators |
|---|
In the last session, I explained how combining Divergence with other indicators can help a trader make more informed decisions about trades, so now we want to learn what kind of indicators can be used hand in hand with divergence and we can make better informed trading decisions using them. Here are some effective combinations;
Moving Averages:
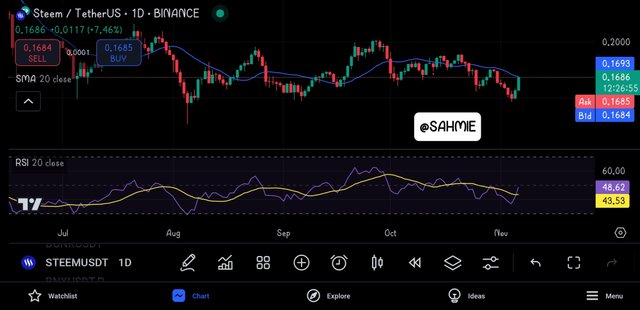
Moving averages help smooth out price data and identify the overall trend direction. By combining moving averages with divergence, traders can confirm whether the market is in an uptrend or downtrend. For example, if you notice a bullish divergence (where the price makes lower lows but the indicator shows higher lows) and the price is above a moving average, this can strengthen your bullish outlook. If the Steem token shows this pattern and is above its 50-day moving average, it suggests that the price might continue to rise, providing a stronger buy signal.
 |
|---|
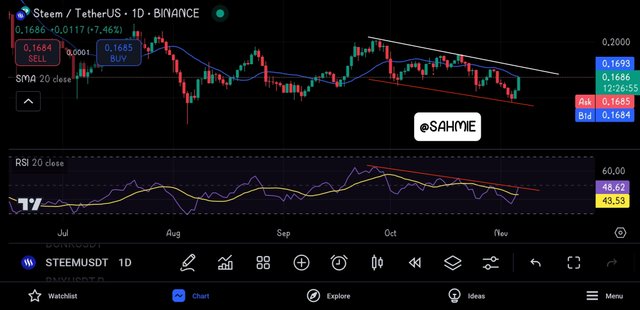
From the above chart and indicators, we can see that both indicators are showing a downward trend by producing lower lows and lower highs as shown below;
 |
|---|
Bollinger Bands:
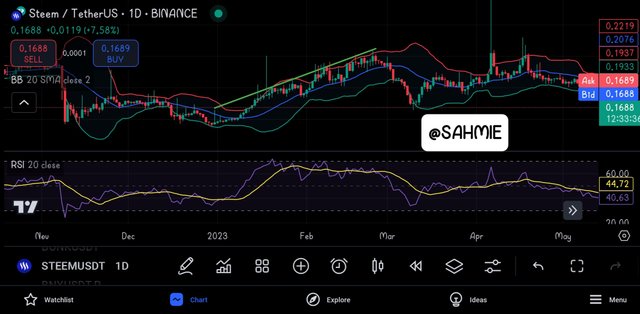
Bollinger Bands consist of a middle band (simple moving average) and two outer bands that represent price volatility. When divergence is spotted alongside price touching the lower Bollinger Band, it can indicate a potential reversal to the upside. Conversely, if the price is at the upper band while showing divergence, it may signal a possible price drop.
These bands help identify volatility and potential price reversals. When the price touches the lower Bollinger Band and you see a bullish divergence, it indicates that the price might bounce back up. For instance, if the Steem token hits the lower band and shows a bullish divergence, traders might expect a price increase soon. Conversely, if the price is at the upper band with a bearish divergence, it suggests that the price might soon drop.
For example, if the price of Steem drops to $0.20, making lower lows, while the RSI shows higher lows. This is a bullish divergence. If you also notice that the price is above the 50-day moving average and has just touched the lower Bollinger Band, it reinforces the idea that the price could rise. Traders might decide to buy Steem, anticipating an upward movement.
 |
|---|
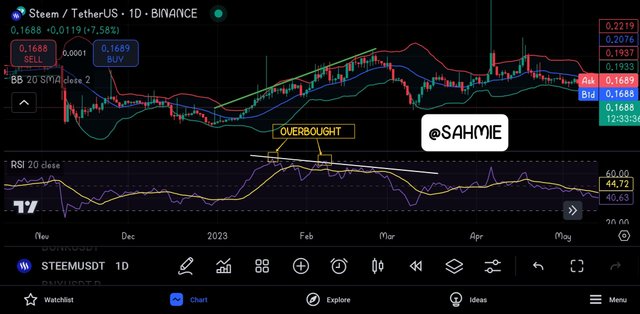
From the above chart, we can see that even though the trend seemed upwards, both the RSI and Bollinger Bands indicators where indicating a reversal as the price was touching and above the upper band signifying an overbought situation while the RSI indicator was also on the overbought line while as showing lower highs as shown below.
 |
|---|
Volume Indicators:
Volume indicators, like the On-Balance Volume (OBV) or Volume Oscillator, can help confirm the strength of a trend. If divergence occurs with increasing volume, it can signal that the price movement is supported by strong buying or selling interest, making the signal more reliable.
Trend Lines:
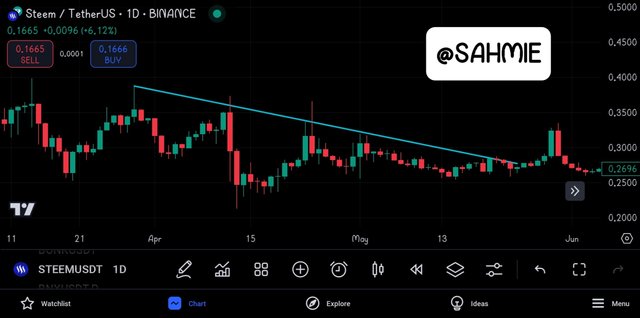
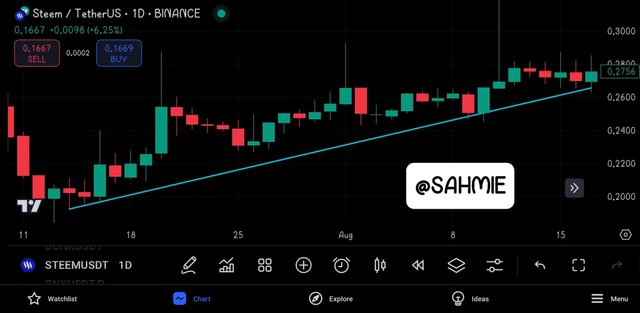
Drawing trend lines can visually represent the direction of price movements. If divergence occurs at a trend line break, it can indicate a potential reversal. For example, if the price breaks below an upward trend line while showing bearish divergence, it may suggest a stronger likelihood of a downtrend.
Developing a Divergence-Based Trading Strategy |
|---|
Here is my simple trading strategy that uses divergence as the main signal for deciding when to enter and exit trades:
Identify Divergence:
First, you want to look for divergence between the price of an asset and a momentum indicator like the Relative Strength Index (RSI) or MACD. For example, if the price of a token like Steem is making lower lows but the RSI is making higher lows, that’s a bullish divergence. This suggests that the selling pressure is weakening, and a price increase might be coming.
Confirm with Other Indicators:
To strengthen your trade decision, check other indicators. For instance, if the price is also above a key moving average (like the 50-day moving average) when you spot the bullish divergence, it adds more confidence to your buy signal.
Entry Point:
Once you confirm the divergence and other indicators are aligned, you can enter a trade. For example, if you see the bullish divergence and the price breaks above the previous resistance level (like a recent high), that can be your entry point.
Set Stop-Loss:
To manage risk, set a stop-loss order just below the recent low. This way, if the trade goes against you, your losses are limited.
Exit Point:
For exiting the trade, look for signs of bearish divergence. If the price starts making higher highs while the RSI starts making lower highs, that’s a signal to exit. You can also use a profit target based on a certain percentage gain or a resistance level where you expect the price might struggle to go higher.
Review and Adjust:
After each trade, review what worked and what didn’t. Adjust your strategy based on your findings to improve future trades.
To confirm any divergence signals and reduce false signals, I would have to use the following criteria and filters:
Time Frame Alignment:
Look for divergence on multiple time frames. For example, if you spot divergence on a 1-hour chart, check if it also appears on the daily chart. This alignment can strengthen the signal and increase confidence in the trade.
Momentum Indicators:
Use momentum indicators like RSI or MACD to confirm divergence. For example, if you see a bullish divergence with price making lower lows, ensure the RSI is below 30 (oversold) or that the MACD line is crossing above the signal line. This can indicate a potential reversal.
Volume Analysis:
Check the trading volume during the divergence. If you notice increasing volume on the price move opposite to the trend (e.g., lower price with increasing volume), it may suggest stronger conviction behind the move, confirming the divergence.
Support and Resistance Levels:
Confirm divergence signals by considering key support and resistance levels. If the divergence occurs near a strong support level (for bullish divergence) or resistance level (for bearish divergence), it adds validity to the signal.
Candlestick Patterns:
Look for candlestick patterns that indicate reversals, such as pin bars or engulfing patterns, around the time of divergence. These patterns can provide additional confirmation for your trade decision.
Avoid Overtrading:
Implement filters to avoid taking trades based solely on divergence. For instance, set a minimum threshold for the strength of the divergence (e.g., a certain number of points difference between price and the indicator) before considering it a valid signal.
Limitations and Best Practices of Divergence Trading |
|---|
Like everything with advantages, we often have disadvantages therefore here are some limitations of divergence trading and how traders can avoid common pitfalls:
False Signals:
Divergence can sometimes trick traders into thinking a price reversal is coming when it’s not. To avoid this, traders should look for confirmation from other indicators or patterns before making a trade based on divergence alone.
 |
|---|
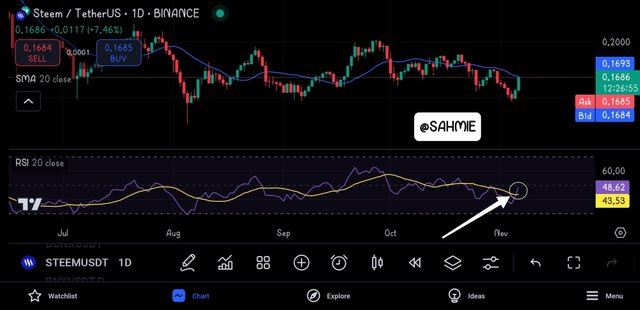
The chart above shows a potential upward trend as the price is currently above the 20-days moving average of the RSI, even though the RSI trends are continually showing lower highs which is also to be seen on the direction of the 20-days moving average on the chart.
Lagging Indicators:
Many indicators used for spotting divergence react after price moves, which means traders might miss the best entry points. To counter this, traders can combine lagging indicators with leading ones that predict future movements.
Market Noise:
In a volatile market, prices can jump around a lot, creating several divergence signals that might not mean anything. To manage this, traders can filter out noise by focusing on higher time frames where trends are clearer and more reliable.
Time Frame Sensitivity:
Divergence can look different depending on the time frame you’re looking at. A signal that seems strong on a short time frame might not hold up on a longer one. Traders should analyze multiple time frames to get a better understanding of the overall trend.
 |
|---|
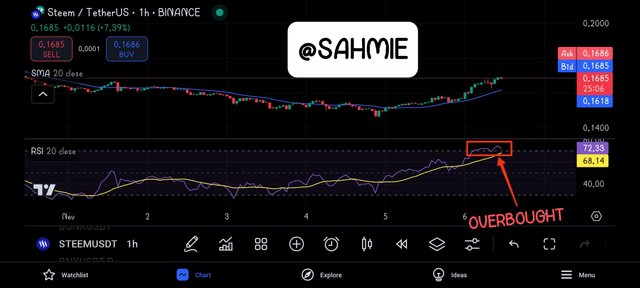
Looking at the above chart, which is STEEM/USDT at a 1-day time frame seems like the price of STEEM is above moving upwards as the price is crossing above the RSI moving average, however looking at the a shorter timeframe we can get different market movements just like the one below;
 |
|---|
Now looking at the same chart under the 1-hour timeframe, we can see that STEEM is already at the overbought range and is expected to make a reversal.
Overreliance on Indicators:
Relying too much on divergence without considering other factors can lead to poor decisions. Traders should use a mix of technical analysis, fundamental analysis, and market sentiment to make well-rounded decisions.
Psychological Factors:
Emotions can cloud judgment when traders see divergence signals. To avoid this, it's essential to stick to a trading plan and set rules for entering and exiting trades, which helps reduce impulsive decisions.
However, traders can learn to avoid the limitations of divergence trading by implementing certain strategies. Strategies such as;
Confirmation with Other Indicators:
To tackle false signals, traders should use additional technical indicators, such as moving averages or the Relative Strength Index (RSI), to confirm divergence signals. For example, if a trader sees a bearish divergence but the RSI is still trending upward, it might be wise to wait for further confirmation before entering a trade.
Combine Leading and Lagging Indicators:
Since divergence indicators can lag, traders can enhance their strategies by including leading indicators like the Stochastic Oscillator. This combination allows traders to get a sense of potential price movements before they happen, giving them a better chance to enter at favorable prices.
Focus on Higher Time Frames:
To filter out market noise, traders should consider analyzing higher time frames, such as daily or weekly charts. This helps to identify more significant trends and reduces the impact of short-term price fluctuations that can create misleading divergence signals.
Multi-Time Frame Analysis:
By looking at divergence across different time frames, traders can gain a more comprehensive view of market conditions. For instance, if a trader sees a divergence on a 1-hour chart, they should check the 4-hour and daily charts to see if the overall trend supports the signal.
Diversify Analysis Techniques:
To avoid overreliance on divergence, traders should incorporate fundamental analysis, such as economic news and events, into their decision-making process. Understanding the broader market context can help traders make more informed choices beyond just technical signals.
Establish a Trading Plan:
Emotional decision-making can be mitigated by setting a clear trading plan that outlines entry and exit points, risk management rules, and profit targets. Following this plan consistently can help traders stay disciplined and avoid impulsive trades based on emotional reactions to divergence signals.
The best practices any trader should have in mind when incorporating divergence into a comprehensive trading plan includes;
Define Clear Criteria for Divergence:
Establish specific rules for identifying divergence, such as the type (regular or hidden) and the timeframe to be used. This clarity helps in maintaining consistency in trading decisions.
Use Multiple Time Frame Analysis:
Check for divergence across various time frames to validate signals. For instance, if a divergence appears on a 15-minute chart, confirm it by analyzing the 1-hour and daily charts to ensure alignment with the overall trend.
Combine with Other Technical Tools:
Integrate divergence signals with other technical analysis tools, such as trend lines, support and resistance levels, and volume analysis. This multi-faceted approach enhances the reliability of the signals.
Set Risk Management Rules:
Always implement strict risk management strategies, such as setting stop-loss orders based on volatility or technical levels. This helps to protect capital and limit losses when trades do not go as planned.
Establish Entry and Exit Points:
Clearly define entry and exit points based on divergence signals. For example, a trader might enter a trade once divergence is confirmed and exit when the price reaches a predetermined target or shows signs of reversal.
Monitor Economic News:
Stay informed about economic events that could impact market conditions. Divergence signals can be affected by news releases, so being aware of upcoming announcements can help traders avoid unfavorable trades.
Review and Adjust the Strategy:
Regularly review trading results and adjust the divergence strategy based on performance. This ongoing evaluation allows traders to refine their approach and adapt to changing market conditions.
CONCLUSION |
Having a good understanding of divergence trading can help traders alike as it is a powerful tool designed to help traders identify potential change in market trends and make informed decisions about when to buy or sell an asset by observing the relationship between the price movement of the asset.
DISCLAIMER: Everything on this publication is not in any way a trading advice but just a piece of my understanding for learning purposes.
I wish to invite @starrchris, @bossj23, @ngoenyi, and @ruthjoe.
Thank You for your Time
NOTE: Always have a smile on your face, as you are never fully dressed without one.

Upvoted! Thank you for supporting witness @jswit.