📢 Bitcoin Weekly Analysis Bulletin BTC/USDT 🔥 – Last Week of July 2025
🧠 Price Action Overview$BTC
The uptrend remains dominant on the weekly and daily time frames, despite some fluctuations on the shorter time frames (4H, 1H).
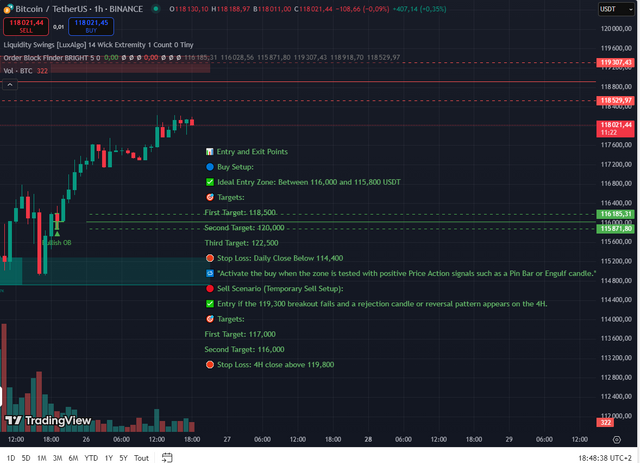
We note the formation of short-term resistance levels between 118,500 and 119,300, with the price failing to break above them on several attempts, opening the door for a temporary technical correction.
On the other hand, there is a very important buying support area between 115,800 and 116,100 that has been successfully tested several times.
📊 Entry and Exit Points
🔵 Buy Setup:$BTC
✅ Ideal Entry Zone: Between 116,000 and 115,800 USDT
🎯 Targets:
First Target: 118,500
Second Target: 120,000
Third Target: 122,500
🛑 Stop Loss: Daily Close Below 114,400
🔁 "Activate the buy when the zone is tested with positive Price Action signals such as a Pin Bar or Engulf candle."
🔴 Sell Scenario (Temporary Sell Setup):$BTC
✅ Entry if the 119,300 breakout fails and a rejection candle or reversal pattern appears on the 4H.
🎯 Targets:
First Target: 117,000
Second Target: 116,000
🛑 Stop Loss: 4H close above 119,800
🔁 "This is a counter-trend trade – use strict money management."
📐 Daily Pivot Levels (Extracted from previous day's data):
PP: 116,938
R1: 119,156
R2: 120,671
S1: 115,423
S2: 113,206
🔎 Professional Technical Summary by Time Frame
Frame Trend Notes
Weekly 🔵 Bullish, good bounce from Bullish OB – resistance at 123K
Daily 🔵 Bullish, fluctuating within the range of 115K – 120K
4H 🟠 Sideways, strong resistance at 119.3K – crucial support at 117K
1H 🟢 Short-term bullish, potential retest of 119.8K
🧠 Pro Tips:
Don't rush to buy at the tops; wait for corrections to support areas.
Monitor volume and MACD/RSI on the 4H and 1H charts for price spikes.
Don't enter the market before important news events like the CPI or NFP – adhere to risk management.
