Steem/USDT Scalping – Mastering Short-Term Trading Strategies [UA/EN]

Шо таке скальпінг ?
Скальпінг це вид торгового підходу на фінансових ринках, який передбачає короткострокові позиції. Прям таки зовсім маленькі по часові та відстані. Коли фіксація прибутку передбачається від 1-2 пункта і більше. Таких угод може бути багато за день чи годину. Головна перевага, в, тому що рух активу відбувається постійно в обидва боки, якщо говорити про ф'ючерс, де отримувати прибуток і від зниження.
На відміну від інших типів торгівлі, де передбачається утримування позиції довше, як-то дейтрейдних і далі в сторону зростання. Скальпінг спрямований до використання менших часових періодів: M1, M5, M15, M30 та інших.
Сигнали там можуть формуватись як і у звичайних торгових стратегіях, але тривати значно коротше. Наприклад фігура "Голова та Плечі", на дрібних тайм фреймах (далі ТФ), може дати рух всього на 5-10 пунктів при визначенні в 4 знаках після коми.
Тож щоб отримати сумарний хороший прибуток, то потрібно виконувати багато угод, щоб за підсумком дня була більш-менш нормальна сума. Для цього варто враховувати розмір комісії, щоб після закриття позиції, вона була в плюс.
Тобто коли відсутній хороший рух ціни по прямій в 50-200 пунктів, то скальпінг дозволяє набирати його маленькими частинками. Доки ціна у невеликому діапазоні, чи активність на ринку знижується.
Якщо підходити із класичним мані менеджментом, то ризики будуть не такі великі. Інша справа, якщо підходити агресивно із використанням усереднення чи мартінгейлу, що може скоротити кількість виконаних ордерів за день.
Особливості
Скальпінг у ручному режимі несе значно більше навантаження на психіку, бо треба більше обробляти даних та постійно торгувати в певному темпі.
Які торгові пари підходять для скальпінгу
По суті будь-які, але потрібно враховувати волатильність та індивідуальну поведінку. Наприклад STEEM/USDT спокійніший переважний час. Наприклад, за останні дні від 10 по 12 березня 2025 року STEEM виріс із 0.1145 до 0.1300. В той самий час Worldcoin (WLD) від 0.7058 дістав до 0.8603 USDT за монету і гасає як шолоплений. Значить друга монета буде давати більше сигналів та може швидше відпрацьовувати угоди. В той час STEEM даватиме менше можливостей.
Індикатори для скальпінгу
По суті можна використовувати багато із доступних і розробляти власні. Тож для прикладу розглядаються деякі класичні індикатори, з усталеними параметрами, як вони є у постачальника TraidingView. Часовий період M3 (3 хвилини)
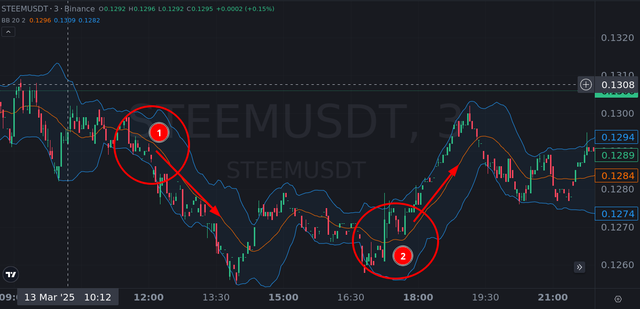
3 SMA (колір змінений вручну)
Прості ковзні середні. Три штуки. Сигнальна синя найшвидша, жовта повільніша і найстарша аквамаринова. Принцип простого перетину, але із додатковим підтвердженням. Наприклад, сині перетинає жовту, щоб лише привернути увагу, а кращий сигнал коли вони разом пройдуть аквамаринову. Точки 1 та 2 на малюнку добре це ілюструють, де є понад 20п.

MACD
Можна шукати дивергенцію чи щось в тому роді. Із 12 до 20 години, три сигнали, десь по 10п.

Лінії Болінджера
Дозволяють виконувати угоди від країв, або в напрямку. Зображено два приклади коли ціна утворює невеликий тренд:
- № 1 Низхідний - перетин середньої зверху вниз, яка стає опором, від якого рухається в каналі доповненому нижньою лінією.
- № 2 Висхідний - перетин середньої знизу вгору, яка стає підтримкою, а верхня утворює канал.

RSI
Методика покупки коли показник десь біля позначки 20.00 із фіксацією на 50-60.00. Аналогічно із продажем, але від 80.00 та цілями на 50-40.00. Дає трішки більше ризику, бо не всі сигнали мають 10+ пунктів, а деякі 1-3п. Тож треба більше набирати досвіду, щоб краще розпізнавати картинку.

MA cross
MA перетин в одному індикаторі, із графічними позначками, щоб краще було видно. Результат приблизний на 9 точок:
- 40% - 1-5п;
- 60% - 10-30п.
Якщо правильно підійти із ризиками, захистом та фіксацією. То теж нормально.
Volume Profile + VWAP
Профіль Обсягу та середньозваженої ціни, теж можуть бути придатними. Лінія POC (червона) буде як важливий рівень, а VWAP додаткове підтвердження.

Точки 1 та 2 на знімку є прикладом, хорошого зниження під POC та VWAP лінію, а 3 виходу над ними. Однак деякі важливі моменти воно все ж упускає, хоча й дає ніби надійніші сигнали.
Управління ризиками в скальпінгу
До питання ризиків у скальпінгу можна підходити із різних боків. Кожен із них може мати свій результат і можливості.
Класичний
Це стандартний варіант зі звичайними 1-2% стоп лосу на угоду від розміру депозиту, а то й меншу. Різниця лише у цільовій кількості пунктів для тейк профіту.
Агресивний
Передбачає високі ставки на підвищене кредитне плече, щоб отримати високий прибуток. Може бути 1/10. Тобто обсяг угоди підраховується таким чином, щоб виходило нормально як по стоп лосу, так і тейк профіту. Точку входу треба шукати надійнішу.
Бува, досвідчені трейдери роблять одну-дві угоди на добу і все, але ретельно вивіряють сигнали.
Для цього рекомендовано розділити капітали на декілька частин, або використовувати ізольовану маржу, щоб обмежити ймовірні втрати. А прибуток деякими долями переводити на інший рахунок. Якщо це ф'ючерс, то на спот чи навіть на окремий гаманець.
Усереднення
Усереднення це коли не виграшну угоду, пробують перекрити більшим обсягом наступної, щоб швидше повернути втрачене.
Мартінгейл
Кожна наступна угода має більший обсяг ніж попередня. Зазвичай застосовується для набору цілої сітки позицій на більших часових періодах. Проте можна застосовувати підхід і до скальпінгу, коли є хороші мікротренди, щоб розігнатись на 10-30 пунктів. Що може дати дві три покупки у одному напрямку зі збільшенням обсягу на кожні наступну. Тоді потрібно проводити активний захист і переносити стоп лоси, по можливості за крайню угоду. Наприклад, коли угода йде в плюс, то стоп лоси трейду №1, переноситься на точку входу трейду №2. Якщо є рух далі, то можна стопи №1 №2 №3 перенести до точки входу треду №3.
Ключові моменти
Звичайно потрібно враховувати деякі моменти:
- розмір стоп лосу не може бути великий;
- якщо стоп лос не застосовується, то треба чітко розуміти, що декілька пунктів в мінус і треба закривати угоду;
- замалий стоп лос, може часто спрацьовувати, тож треба знаходити оптимальний баланс;
- також має бути чіткий план та дії, щодо фіксації прибутку, щоб без довгих очікувань.
Кредитне плече
Кредитне плече потенційно збільшує наявний капітал для угоди, для отримання вищого прибутку, з розрахунку на один пункт. Тобто придбавши без плеча монет по 100 монет по 0.10 USDT на 10 USDT, і продавши по 0.15, це буде 15 USDT. Із плечем х10 на по тій же ціні й на ту ж суму, можна взяти 1000 монет. Продані по 0.15, дадуть +50USDT до балансу, що складе 60USDT (без врахування комісії та маржинального ліміту на ліквідацію). Проте є ризики, коли ціна піде проти угоди, тоді 10 USDT можуть згоріти значно швидше.
Однак це дає хорошу можливість тренуватись. Торгові пари де мінімальний обсяг угоди 5.15 USDT, можуть забезпечуватись десь 0.35-0.5 USDT капіталу.
Уникнення ліквідації при скальпінгу
На звичайному споті такого не буде, бо монети просто залишаться, але будуть знецінюватись. На ф'ючерсі, щоб уникнути ліквідації, потрібно слідкувати, щоб маржі було достатньо для забезпечення угоди (або декількох). А це досягається хорошими точками входу та правильним мані менеджментом, конкретно під наявний депозит.
Як відкривати численні угоди?
Насправді численні угоди відкривати не рекомендується, особливо на початку. Краще переходити від однієї угоди до іншої. Тобто нову відкривати лише після закриття попередньої. Так менше ризику й плутанини. Часом супровід однієї угоди мінімізує втрати, ніж це декілька хаотично відкритих.
Якщо сверблять руки, то є декілька можливостей:
- торгівля з графіка;
- свої розробки, якісь скрипти чи ще щось. Наприклад на платформі TraidingView;
- сторонні торгові термінали, які мають розширений функціонал із управлінням через API$;
- запустити або розробити алгоритмічну стратегію чи торгового бота на основі ШІ із доступом через API;
- зробити чи знайти напівавтоматичний інструмент для управління угодами, просто щоб віддавати команди через API.
Є де розвернутись, але перші три варіанти прості й доступні.
Стратегія скальпінгу
Часовий період: М3-М5
Наші інструменти (індикатори), налаштування усталені, як є і без змін:
- Volume Profile (Профіль Об'єму видимого графіку): Це як карта скарбів. Він показує, на яких цінових рівнях було найбільше торгів (найбільший об'єм). Ці рівні – як сильні магніти, ціна часто до них повертається або від них відскакує.
- POC (Point of Control): Найбільш "наторгований" рівень. Найсильніший "магніт".
- Value Area (Зона Вартості): Область, де було укладено 70% угод. Важлива зона підтримки/опору.
- VWAP (Середньозважена Ціна за Об'ємом): Це як середня ціна, за якою всі сьогодні торгували. Якщо ціна вище VWAP – бики (покупці) сильніші, якщо нижче – ведмеді (продавці).
- CCI (Commodity Channel Index): Це як термометр. Він показує, наскільки ціна "перегріта" (перекуплена) або "переохолоджена" (перепродана):
- Вище +100: Перекупленість. Можливий розворот вниз.
- Нижче -100: Перепроданість. Можливий розворот вгору.
- -200 +200 - розширений діапазон із більшою силою.
- Сигнал буде кращий, коли CCI перетинає Smoothed MA для покупки вгору, а продажу - вниз.
- MA Cross (Перетин Ковзних Середніх): Це як два бігуни. Один швидкий (коротка MA), інший повільніший (довга MA). Коли швидкий бігун обганяє повільного – це сигнал купувати (лонг). Коли повільний обганяє швидкого – продавати (шорт). Індикатор сам показує стрілочки на перетинах.
- Тренд - визначається глобальний напрямок на старших H1-H4, D1-W1. Тобто коли ринок падає, то пріоритетніше продавати, а покупки якщо й робити, то ставити коротші цілі.
Шукаємо можливості (сигнали):
Варіант 1 (сильний)
Лонг (купівля):
Ціна біля POC або нижньої межі Value Area (підтримка від Volume Profile).
- Ціна вище VWAP (бики сильніші).
- CCI виходить з перепроданості (нижче -100) або просто нижче 0.
- MA Cross показує перетин вгору (швидка зелена MA перетинає повільну помаранчеву знизу вгору).
Шорт (продаж):
- Ціна біля POC або верхньої межі Value
- Area (опір від Volume Profile).
- Ціна нижче VWAP (ведмеді сильніші).
- CCI виходить з перекупленості (вище +100) або просто вище 0.
- MA Cross показує стрілку вниз (швидка MA перетинає повільну зверху вниз).
Варіант 2 (слабший) передбачає спрощення першого, де VWAP використовується як окремий рівень опору/підтримки або як орієнтир для тейк профіту. Бо вони не завжди збігаються із POC лінією і між ними можу бути канал для торгівлі.
Входимо в угоду:
Лонг: Купуємо, коли мінімум два важливих сигнали зійшлись.
Шорт: Як для лонгу, тільки в зворотному напрямку.
Ставимо захист (Стоп-лосс):
Лонг: Стоп-лосс трохи нижче найближчого мінімуму, нижче POC, або нижче нижньої межі Value Area.
Шорт: Стоп-лосс трохи вище найближчого максимуму, вище POC, або вище верхньої межі Value Area.
Фіксуємо прибуток (Тейк-профіт):
Варіант 1 (швидкий): Тейк-профіт у 1-2 рази більше, ніж стоп-лосс (співвідношення 1:1, 1:1.5, 1:2).
Варіант 2 (за індикаторами):
Лонг: Закриваємо, коли CCI заходить у перекупленість, або коли MA Cross дає зворотний перетин.
Шорт: Закриваємо, коли CCI заходить у перепроданість, або коли MA Cross дає зворотний перетин.
- Варіант 3 (до найближчого рівня):
- Лонг: Тейк-профіт біля найближчого рівня спротиву (наприклад, верхня межа Value Area, або попередній максимум).
- Шорт: Тейк-профіт біля найближчого рівня підтримки.
- Варіант: 4 (до VWAP за наявності таки умов):
- Лонг: Цільовий орієнтир лінія VWAP, коли вона вище POC індикатора Volume Profile у невеликому каналі.
- Шорт: Аналогічно до лонгу, тільки коли VWAP під POC.
Приклад WLDUSDT (більша волатильність). На зображенні є обидва варіанти.
Лонг №1:
- Ціна перейшла вище VWAP.
- CCI відштовхнувся від -100 й перетнув Smoothed MA
- MA Cross перетин в гору.
Купуємо!
Buy 0.8717
SL 0.8701 - трохи нижче VWAP, що задовольняє межі Value Area.
TP 0.8747 - орієнтовно до +100 CCI, десь у 1.5-2.0 рази більше, ніж відстань до стоп лоссу, або біля верхньої межі Value Area.

Шорт №2:
- MA cross, перетин вниз.
- Ціна зайшла під POC.
- CCI під Smoothed MA на +100.
Продаємо!
Sell 0.8777
SL 0.8788 - вище POC
TP 0.8736 - в межах -100 CCI та поблизу підтримки VWAP, яка поблизу нижнього кордону Value Area. Що забезпечує оптимально безпечну та досяжну відстань.
Розгляд гіпотетичного сценарію
Трейдер торгує по стратегії, дотримується маною менеджменту та встановлених ризиків. Без емоцій та жадібності вчасно фіксує прибуток, навіть коли це 1 чи 0 пунктів. Час від часу ринок пожвавлюється і волатильність зростає, що призводить до спрацювання стоп лосів. Оскільки захист від надмірних втрат постійно встановлюється, то загальний результат позитивний, навіть із певним відсотком угод із мінусовим значенням. Окрім цього активно використовує перенесення стоп лосів в прибуткове положення відносно точки входу. Чи навіть до рівня тейк профіту, який теж підіймається вище, якщо ринок дає хороший рух, щоб отримати додатковий прибуток і уникнути ризику. Не відкриває багато угод, що не підтверджені умовами стратегії. Таким чином, навіть при різких змінах на ринку, трейдер зберігає позитивний загальний результат і демонструє стійкість. Ось ключові фактори його успіху:
- Дисципліна
- Мані менеджмент із дотриманням ризиків
- Чіткі цілі встановлені в TP
- Захист позицій із перенесенням стоп лосу
- Орієнтованість лише на хороші сигнали, що зменшує кількість ризикованих угод
- Розуміння ринку
Підсумок, навіть найуспішніші професіонали можуть мати мінусові угоди, але стратегія, емоційна стійкість, мані менеджмент та план, дають хороший загальний результат.
Використані джерела та ресурси:
- Всі знімки екрана із графіками зроблені на вебсайті криптобіржі https://www.binance.com
- Консультації та переклад від ШІ.
| EN translated by AI |
|---|
What is Scalping?
Scalping is a trading approach in financial markets that involves taking very short-term positions. We're talking really short, both in time and price movement. Profit is typically taken at just 1-2 points (pips) or more. A scalper might make many of these trades in a single day or even an hour. The main advantage is that the price of an asset is constantly moving in both directions. This is especially true when trading futures, where you can profit from both price increases and decreases.
Unlike other trading styles that involve holding positions for longer periods, such as day trading and longer-term strategies, scalping focuses on smaller timeframes: M1 (1 minute), M5, M15, M30, and so on.
Signals in scalping can be generated similarly to regular trading strategies, but they are much shorter-lived. For example, a "Head and Shoulders" pattern on small timeframes (TFs) might only result in a movement of 5-10 points (assuming a price quoted to 4 decimal places).
Therefore, to achieve a good overall profit, you need to execute many trades to accumulate a reasonable sum by the end of the day. It's crucial to consider the size of trading commissions to ensure that you're still profitable after closing a position.
In essence, when there isn't significant, direct price movement of 50-200 points, scalping allows you to capture gains in small increments. This is particularly useful when the price is range-bound or market activity is low.
If you approach scalping with classic money management, the risks are relatively low. However, if you use aggressive strategies like averaging down or Martingale, the number of trades you can execute per day might be reduced, and risk significantly increases.
Key Characteristics
Manual scalping places a significantly higher mental burden on the trader because it requires processing a lot of data and constantly trading at a certain pace.
Which Trading Pairs are Suitable for Scalping?
Essentially, any pair can work, but you need to consider volatility and the individual behavior of each asset. For example, STEEM/USDT is generally calmer most of the time. For instance, in recent days between March 10th and 12th, 2025, STEEM rose from 0.1145 to 0.1300. Meanwhile, Worldcoin (WLD) went from 0.7058 to 0.8603 USDT per coin and is much more volatile. This means the second coin will provide more signals and potentially execute trades faster, while STEEM may offer fewer opportunities.
Indicators for Scalping
You can use many of the available indicators and even develop your own. For this example, we'll look at some classic indicators with their standard settings, as provided by TradingView. We'll use the M3 (3-minute) timeframe.
Okay, here's the English translation, preserving the formatting as requested:
3 SMAs (colors manually changed)
Simple Moving Averages. Three of them. The signal (blue) is the fastest, the yellow is slower, and the aquamarine is the slowest. The principle is based on simple crossovers, but with additional confirmation. For example, the blue crossing the yellow might just be an alert, while a stronger signal occurs when both cross the aquamarine. Points 1 and 2 in the image illustrate this well, showing movements of over 20 pips.
MACD
You can look for divergences or similar patterns. From 12:00 to 20:00, there are three signals, each around 10 pips.
Bollinger Bands
These allow you to trade from the edges or in the direction of the trend. Two examples are shown where the price forms a small trend:
- №1 Downtrend: The price crosses the middle band from top to bottom, which then acts as resistance. The price moves within the channel defined by the middle band and the lower band.
- №2 Uptrend: The price crosses the middle band from bottom to top, which then acts as support. The upper band forms the channel.
RSI
The strategy here is to buy when the indicator is near the 20.00 level and take profit around 50-60.00. Similarly, sell when the indicator is near 80.00 and target 50-40.00. This carries slightly more risk because not all signals will result in 10+ pips; some might only be 1-3 pips. Therefore, you need more experience to better recognize the patterns.
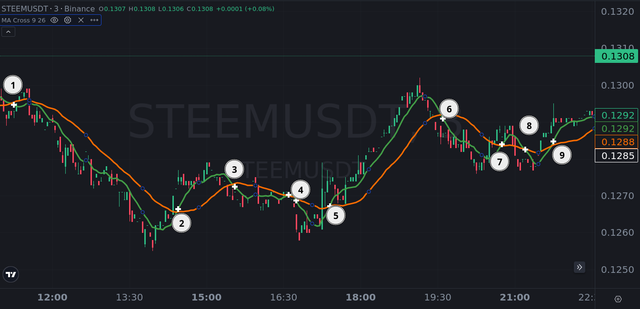
MA Cross
This is a single indicator that shows MA crossovers with graphical markers for better visibility. The approximate results are based on 9 points:
- 40% - 1-5 pips;
- 60% - 10-30 pips.

With proper risk management, stop-losses, and profit-taking, this can be effective.
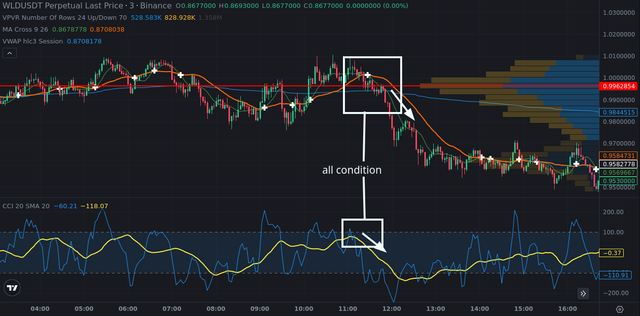
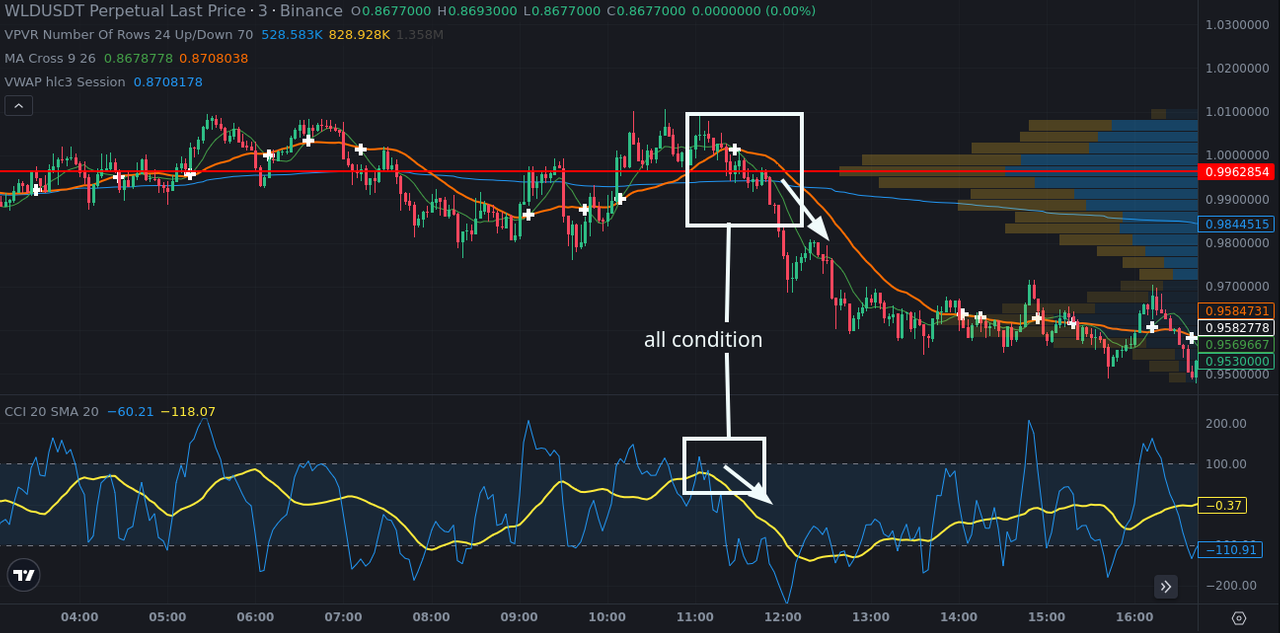
Volume Profile + VWAP
The Volume Profile and Volume Weighted Average Price can also be useful. The Point of Control (POC) line (red) acts as a significant level, and the VWAP provides additional confirmation.
Points 1 and 2 in the image show examples of good declines below the POC and VWAP lines, and point 3 shows a break above them. However, it can miss some important moments, although it tends to provide more reliable signals.
Risk Management in Scalping
The issue of risk in scalping can be approached from different angles. Each approach has its own potential outcomes and opportunities.
Classic
This is the standard approach with a typical 1-2% stop-loss per trade based on the deposit size, or even less. The only difference is the target number of pips for the take-profit.
Aggressive
This involves higher stakes with increased leverage to achieve higher profits. It could be a 1/10 ratio. The trade volume is calculated to be appropriate for both the stop-loss and take-profit. You need to find a more reliable entry point.
Experienced traders sometimes make only one or two trades per day, but they carefully verify the signals.
It's recommended to divide your capital into several parts or use isolated margin to limit potential losses. Transfer a portion of your profits to another account. If you're trading futures, move profits to your spot account or even a separate wallet.
Averaging Down
Averaging down is when you try to offset a losing trade with a larger subsequent trade to recover losses faster.
Martingale
Each subsequent trade has a larger volume than the previous one. This is typically used to build a grid of positions on larger timeframes. However, the approach can also be applied to scalping when there are good micro-trends to capitalize on movements of 10-30 pips. This might involve two or three buy orders in the same direction, increasing the volume with each subsequent order. In this case, you need to actively manage risk and move stop-losses, if possible, to the entry point of the most recent trade. For example, if a trade is in profit, the stop-loss for trade №1 is moved to the entry point of trade №2. If the price continues to move favorably, you can move the stop-losses for trades №1, №2, and №3 to the entry point of trade №3.
Key Considerations
Of course, you need to consider several points:
- The stop-loss cannot be too large.
- If you don't use a stop-loss, you need to be absolutely clear that you'll close the trade after a few pips of loss.
- A stop-loss that is too small can be triggered frequently, so you need to find the optimal balance.
- You should also have a clear plan and actions for taking profits without waiting too long.
Leverage
Leverage potentially increases the available capital for a trade to achieve higher profits per pip. For example, if you buy 100 coins at 0.10 USDT without leverage (spending 10 USDT) and sell them at 0.15 USDT, you'll have 15 USDT. With 10x leverage, you can buy 1000 coins at the same price and with the same amount. Selling them at 0.15 USDT would add +50 USDT to your balance, resulting in 60 USDT (excluding commissions and the margin liquidation limit). However, there's a risk that if the price moves against your trade, your 10 USDT could be lost much faster.
However, leverage provides a good opportunity for practice. Trading pairs where the minimum trade size is 5.15 USDT can be managed with around 0.35-0.5 USDT of capital.
Avoiding Liquidation in Scalping
This won't happen on the spot market because the coins will simply remain, although they will depreciate. On the futures market, to avoid liquidation, you need to ensure you have sufficient margin to cover the trade (or multiple trades). This is achieved through good entry points and proper money management tailored to your available deposit.
How to Open Numerous Trades?
It's actually not recommended to open numerous trades, especially at the beginning. It's better to move from one trade to the next. That is, open a new trade only after closing the previous one. This reduces risk and confusion. Sometimes, managing a single trade minimizes losses more effectively than several chaotically opened ones.
If you feel the urge to open many trades, there are several options:
- Trading directly from the chart.
- Developing your own scripts or tools. For example, on the TradingView platform.
- Using third-party trading terminals that offer extended functionality and API management.
- Running or developing an algorithmic strategy or a trading bot based on AI with API access.
- Creating or finding a semi-automated tool for managing trades, simply to send commands via the API.
There are many possibilities, but the first three options are simple and accessible.
Scalping Strategy
Timeframe: M3-M5
Our Tools (Indicators), with default settings (no changes):
- Volume Profile (Visible Range): Think of this as a treasure map. It shows the price levels where the most trading activity (highest volume) occurred. These levels act like strong magnets; the price often returns to them or bounces off them.
- POC (Point of Control): The most traded level. The strongest "magnet."
- Value Area (VA): The area where 70% of trades were executed. An important support/resistance zone.
- VWAP (Volume Weighted Average Price): This is like the average price everyone traded at today. If the price is above VWAP, bulls (buyers) are stronger; if it's below, bears (sellers) are stronger.
- CCI (Commodity Channel Index): This is like a thermometer. It shows how "overheated" (overbought) or "overcooled" (oversold) the price is:
- Above +100: Overbought. Possible reversal downwards.
- Below -100: Oversold. Possible reversal upwards.
- -200 and +200: Extended ranges showing a stronger signal.
- The signal is best used when the CCI crosses it's Smoothed MA for a buy (upwards), or a sell (downwards).
- MA Cross (Moving Average Crossover): Think of this as two runners. One is fast (short MA), the other is slower (long MA). When the fast runner overtakes the slow one, it's a buy (long) signal. When the slow runner overtakes the fast one, it's a sell (short) signal. The indicator itself shows arrows at the crossovers.
- Trend - The overall market trend is determined using the bigger time frames H1-H4 and D1-W1. Therefore, if the market is falling, it's best to prioritize selling. Any purchases should have shorter goals.
Finding Opportunities (Signals):
Option 1 (Stronger)
Long (Buy):
- Price is near the POC or the lower boundary of the Value Area (support from Volume Profile).
- Price is above VWAP (bulls are stronger).
- CCI is coming out of oversold territory (below -100) or simply below 0.
- MA Cross shows an upward crossover (fast green MA crosses slow orange MA from below).
Short (Sell):
- Price is near the POC or the upper boundary of the Value Area (resistance from Volume Profile).
- Price is below VWAP (bears are stronger).
- CCI is coming out of overbought territory (above +100) or simply above 0.
- MA Cross shows a downward arrow (fast MA crosses slow MA from above).
Option 2 (Weaker) simplifies the first one, where VWAP is used as a separate support/resistance level or as a target for take-profit. This is because VWAP doesn't always coincide with the POC line, and there might be a trading channel between them.
Entering a Trade:
Long: Buy when at least two important signals align.
Short: Same as for long, but in the opposite direction.
Setting Protection (Stop-Loss):
Long: Stop-loss slightly below the nearest low, below the POC, or below the lower boundary of the Value Area.
Short: Stop-loss slightly above the nearest high, above the POC, or above the upper boundary of the Value Area.
Taking Profit (Take-Profit):
Option 1 (Fast): Take-profit 1-2 times larger than the stop-loss (ratio of 1:1, 1:1.5, 1:2).
Option 2 (Based on Indicators):
- Long: Close when CCI enters overbought territory or when MA Cross gives a reverse crossover.
- Short: Close when CCI enters oversold territory or when MA Cross gives a reverse crossover.
Option 3 (To the Nearest Level):
- Long: Take-profit near the nearest resistance level (e.g., upper boundary of the Value Area or previous high).
- Short: Take-profit near the nearest support level.
Option 4: (Using the VWAP when possible)
- Long: Target the VWAP when it is above the POC and there is a small channel between them.
- Short: Similar to a long, only when the VWAP is below the POC.
Example: WLDUSDT (Higher Volatility). Both options are shown in the image.
Long №1:
- Price moved above VWAP.
- CCI bounced off -100 and crossed the Smoothed MA.
- MA Cross upward crossover.
Buy!
Buy: 0.8717
SL: 0.8701 - slightly below VWAP, which meets the Value Area boundaries.
TP: 0.8747 - approximately to +100 CCI, about 1.5-2.0 times the distance to the stop-loss, or near the upper boundary of the Value Area.
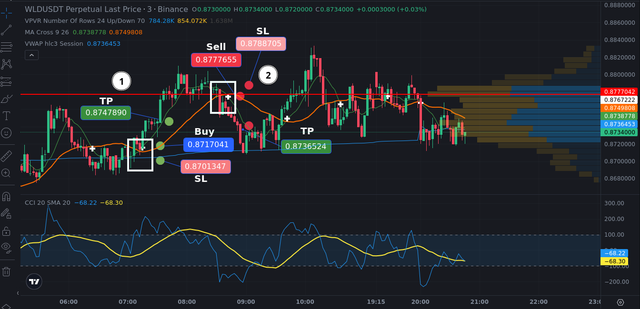
Short №2:MA cross, downward crossover.
Price went below POC.
CCI below Smoothed MA at +100.
Sell!
- Sell: 0.8777
- SL: 0.8788 - above POC
- TP: 0.8736 - within the -100 CCI range and near the VWAP support, which is close to the lower boundary of the Value Area. This provides an optimally safe and achievable distance.
Hypothetical Scenario Analysis
A trader follows their strategy, adheres to money management and established risk limits. Without emotion or greed, they take profits on time, even if it's just 1 or 0 points. Occasionally, the market becomes more active and volatility increases, leading to stop-losses being triggered. However, since protection against excessive losses is constantly in place, the overall result is positive, even with a certain percentage of trades resulting in losses. In addition, the trader actively uses trailing stop-losses to move them to a profitable position relative to the entry point, or even to the take-profit level, which is also raised if the market shows good movement, to capture additional profit and avoid risk. They do not open many trades that are not confirmed by the strategy's conditions. Thus, even with sharp market changes, the trader maintains a positive overall result and demonstrates resilience. Here are the key factors for their success:
- Discipline
- Money management with adherence to risk limits
- Clear targets set in TP
- Position protection with trailing stop-losses
- Focusing only on good signals, reducing the number of risky trades
- Understanding of the market
In conclusion, even the most successful professionals can have losing trades, but a solid strategy, emotional stability, money management, and a plan lead to good overall results.
Sources and Resources Used:
- All screenshots with charts were taken from the website of the cryptocurrency exchange https://www.binance.com
- Consultations and EN translation by AI.
#ukraine #cryptoacademy-s23w4 #steem #usdt #steemusdt #crypto #trading #scalping