SteemitCryptoAcademy-Bitcoin and Crypto Markets Analysis - April 19, 2025- Bitcoin's Unfinished Bull Cycle

Hello steemians,
The analysis of the graph presented, which traces the evolution of the price of Bitcoin from the year 2013 to a projection going beyond 2025, highlights, through a methodical reading of the successive peaks and troughs, a cyclical dynamic which still seems unfinished, to the extent that the central technical indicator, namely the RSI (Relative Strength Index) in monthly data, has not yet reached the zones historically associated with phases of extreme overbought, which traditionally mark the end of a major bullish cycle.
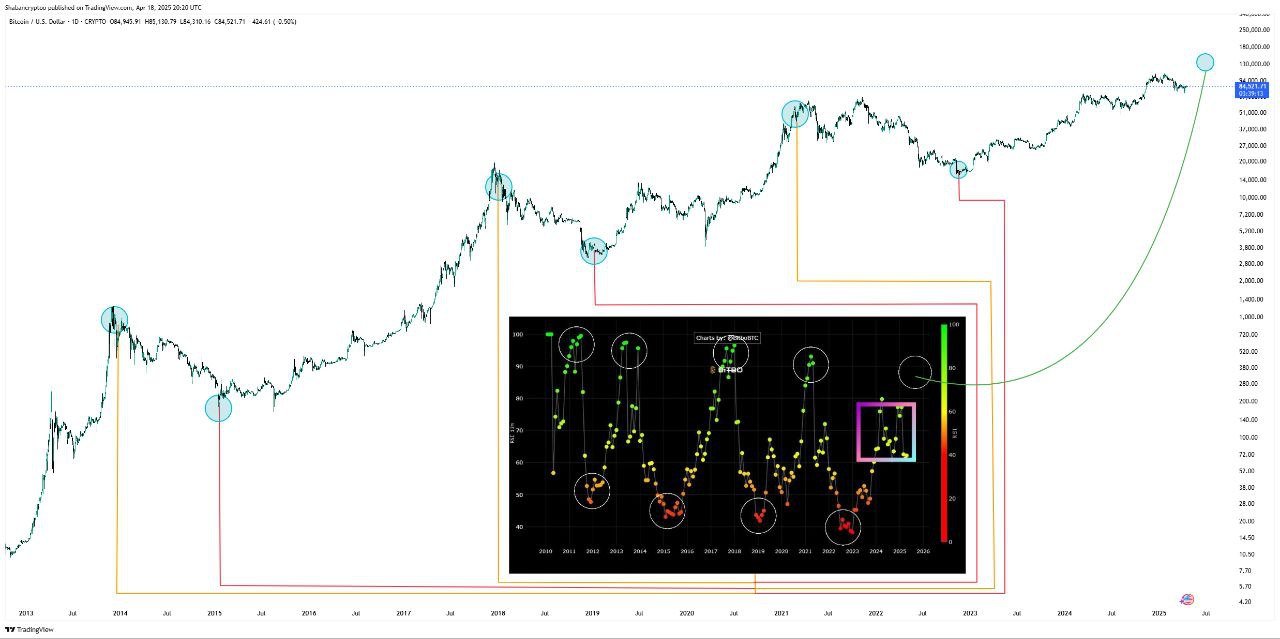
By carefully observing the visual cues highlighted by the blue circles placed on the inflection points of the chart, we understand that each of the historical peaks in 2013, 2017, and 2021 was preceded by a movement of exponential price growth, accompanied, or even preceded, by a sharp rise in the RSI indicator to levels above 80, or even approaching 90, which, in classic technical analysis, reflects a market saturated by buying, often followed by a severe correction or a structural reversal.
However, and this is the heart of the demonstration put forward by this visual modeling, the current cycle - initiated following the trough formed at the end of 2022, following the collapse of the market caused in particular by the bankruptcy of FTX seems to have engaged in a phase of gradual recovery, but without the monthly RSI having for the moment displayed the characteristic signs of an overheated market, which implies, in a prospective perspective, that the peak of this cycle has not yet been reached and the upside potential remains open.
The projection represented by the ascending green curve on the right of the graph, which suggests a price target which could exceed $150,000, is not a matter of simple speculative optimism, but is based on a rigorous reading of past cycles and on the consistency with which the RSI has, in the recent history of Bitcoin, anticipated the moments of change between bullish euphoria and bearish depression, or, in the current state of things, this critical threshold of 70 has not has not yet been crossed sustainably, which supports the hypothesis of an extension of the ascending phase.
It is therefore worth considering that the current upward surge represents only about 70% of the overall path traveled towards the potential peak of the current cycle. This implies, for attentive investors and analysts, not only room for market appreciation in the medium term, but also an opportunity to observe altcoins, these alternative cryptocurrencies to Bitcoin, achieving notable performances in the wake of the BTC locomotive, a phenomenon already observed in the late phases of previous cycles.
This observation logically leads to a cautious but active strategy: as long as the monthly RSI does not display a sign of buyer saturation located between 70 and 90, it is legitimate to consider that the market is not yet ripe for a phase of prolonged decline, and that investment opportunities still exist, provided that critical thresholds are carefully observed, in particular by regularly consulting analysis platforms such as this site https://charts.bitbo.io/monthly-rsi/, which allows you to follow in real time the evolution of this valuable indicator, which acts as a sort of compass in the uncertain world of cryptocurrencies.

In conclusion, the implicit message conveyed by this analytical visualization is strikingly clear: despite the impression that the market might have already given all it could offer, technical reality contradicts this intuition, showing that the typical conditions for a peak are not met, and that, barring a sudden reversal or major exogenous event, Bitcoin maintains a plausible upward trajectory, which could be part of a scenario of surpassing its previous historical records, provided that the indicators, and in particular the RSI, will confirm this outlook in the months to come.
Warm regards,
@kouba01 (Steem Representative)
