Crypto Academy Trading Competition - S6W1 | Team Reminane
Welcome to the first week of the SteemitCryptoAcademy trading competition.
In this first week, I will be joining the team of professors @nane15 and @reminiscence01.

QUESTION 1
The project which I will be talking about is TRON which has (TRX) as its native token.
Tronix which is shortly formed Trx is the native token of the Tron ecosystem which is basically used to gain access to various features of the Tron network.
On the other hand, the Tron network allows the development of various decentralized applications and also enables users to create and share content within the ecosystem. These users are in turn rewarded with a TRX token.
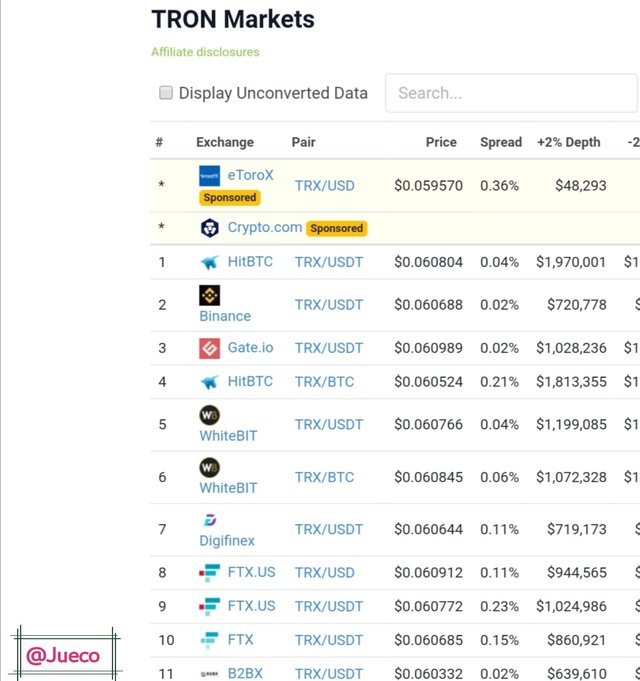
There are various exchanges on which the TRX token can be traded and they include;
- Binance
- Huobi
- Kucoin
- Hitbtc
- WhiteBit
- Gate.io
- LAKOTEN
- OKX
- Bittrex, etc.
- Screenshot
Aside from Justin Sun who is the founder of Tron, the platform has various persons who are involved in its development and they include;
- Lucien Chen
- Keelson Yang
- Hitters Xu, etc.
- Screenshot
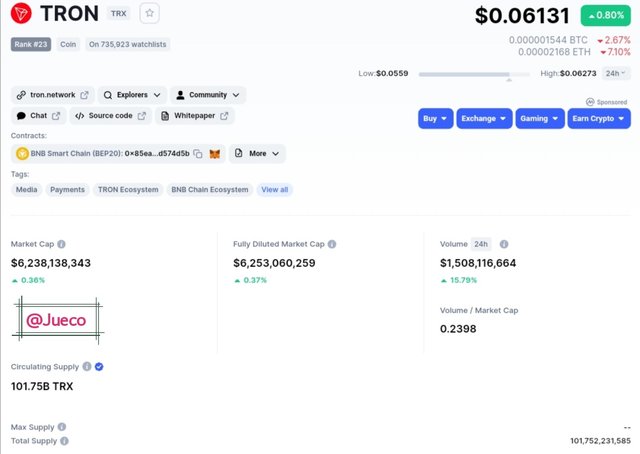
There are other background pieces of information as regards TRX and they are seen below;
| CURRENT PRICE | $0.06141 |
|---|---|
| MARKET CAP | $6,229,142,361 |
| VOLUME | $6,229,142,361 |
| CIRCULATING SUPPPLY | 101.75B TRX |
| MAX SUPPLY | 101,752,231,585 |
| RANK | 22 |
- Screenshot
QUESTION 2
Affect the effect of Russia's attack on Ukraine on Thursday, Bitcoin and other cryptocurrencies went bearish due to a massive sell-off of risky assets.
- screenshot
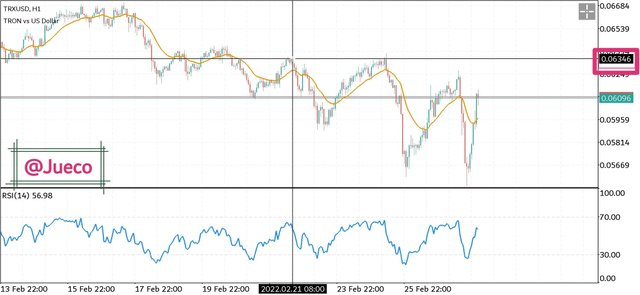
This massive drop in price affected TRX too which saw it drop from a price of 0.06346 to 0.05537 in one day. Later on Friday, Bitcoin started a recovery movement which also made other cryptocurrencies bullish with TRX not being an exception.
For now, I do not think much of TRX but with the current recovery, I think it will at least rise back to its closest major resistance at 0.06346.
- Screenshot
QUESTION 3
I performed an analysis on TRX|USDT PAIR on my MT5 trading app which I funded with $10.
The analysis was performed using trading knowledge primarily acquired from one of the season4-week4 courses by Professor @reminiscence01.
The course which was titled Technical indicators 11 explained the different types of indicators which are leading and lagging indicators and their examples.
The leading indicators which include RSI, Stochastic, Donchian Channel, etc. are indicators that provide fast signals thereby allowing traders to spot possible market movements faster. This in turn helps them to reduce the size of their stop-loss and maximize profits as well.
On the other hand, these leading indicators are not always efficient as factors such as false breakouts, fake reversals, and various other factors can easily mislead traders therefore leading indicators are best combined with other technical analysis tools preferably lagging indicators in other to maximize profits and minimize loss.
The lagging indicators which include Moving averages, Parabolic Sar, MACD, etc. are indicators that wait for price movement confirmation before releasing signals. This makes it less vulnerable to fake outs although it does not allow traders to make maximum profits from price movements due to its slow signal production.
Having understood the above, I set up my trading strategy with the combination of two indicators which represent a leading and lagging indicator respectively.
I also put other factors which I learned from the course into consideration before choosing a trading strategy and these factors include;
- Understanding trading strategy
- Understanding market trend
- Finding confluence
- Understanding type of indicator.
Let me briefly explain the above factors.
This factor deals with the method of trading. An intraday trader and a swing trader mostly use varying indicators in search of signals because an intraday trader mostly relies on leading indicators for signal production while a swing trader wouldn't mind using lagging indicators.
A scalper who is likely to be trading with a small capital will rely more on leading indicators in other to reduce the size of his or her stop-loss.
This factor is important as market behavior determines the type of indicator suitable for it. A trending market requires trend-based indicators, a ranging market requires momentum-based indicators while a high volatility market requires a volatility-based indicator for proper signal identification.
This is where knowing leading and lagging indicators comes in.
One who is trading with a lagging indicator and also wants to spot out possible market movements on time is expected to add a leading indicator in his or her trading strategy.
This is another major factor to be considered as it helps in signals confirmation. Finding confluence can be regarded as reverifying a signal produced by an indicator with a different indicator in other to be more certain of the possible market action.
Having understood all the above, I will move to combine an EMA indicator with an RSI in other to carefully identify signals.
The EMA which is a trend-based indicator serves as a lagging indicator that will be used to spot price direction over time.
The EMA identifies price direction by trending either above or below the price chart. When it trends above the price chart, it indicates a bearish movement and when it trends below the price chart, it indicates a bullish movement.
While the RSI represents a leading indicator that will aid me in identifying price reversals. When the RSI is above the 70-mark which is regarded as an above-bought region, it signals that buyers are being exhausted and sellers have the higher capacity of taking over the market which will result in a bullish-to-bearish price reversal.
On the other hand, when it is below the 30-mark, it is regarded as being at the oversold region which implies that sellers are being exhausted which will result in buyers having an upper hand in the market thereby leading to a bearish-to-bullish trend reversal.
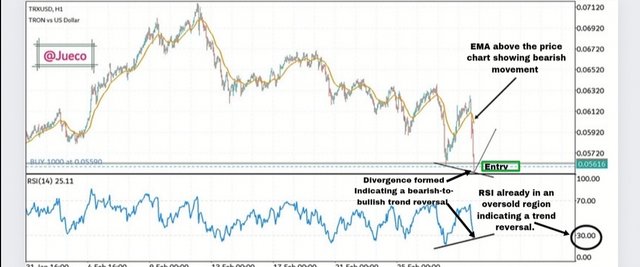
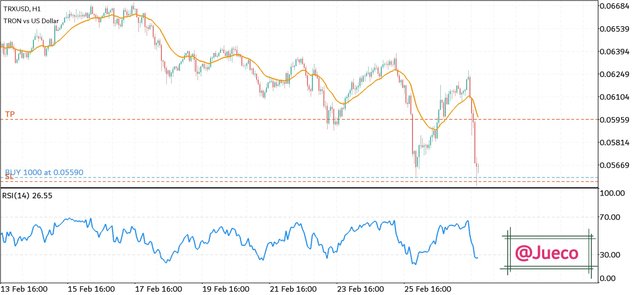
I started by identifying the current market trend using the EMA which identified the trend to be a bearish one by trending above it.
After the trend identification, I noticed on a 1-hr time frame that the price is already at an oversold region as signaled by the RSI.
Being in an oversold region, I looked out for confluence which was produced with the formation of divergence.
- Screenshot
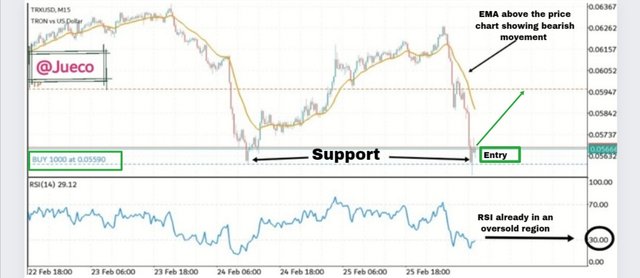
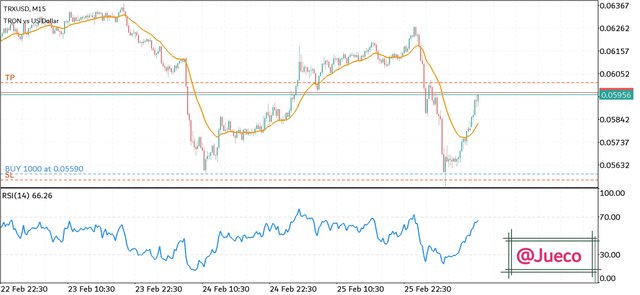
After identifying the above signals which signaled a bearish-to-bullish trend reversal, I switched the time frame to 15-mins in other to identify a more perfect entry as I will be reducing the size of my stop-loss due to my small capital.
On switching to 15-mins time frame I noticed the price also be at the oversold region as identified by the RSI and with the price also being at the support zone, I took a buy position.
- EXIT
I placed my stop-loss just below the support thereby making it tight enough to manage my capital. I only risked $1 which represents 1% of my $10 capital.
Coming to my target, I considered the closest resistance which was found to be above the current price point.
- See screenshot
- ANALYSIS RESULT
From the above screenshot, it is obvious that the price went exactly as predicted and the TP was smashed 😁.
I used the lowest lot size in other to manage risk due to my small capital. In as much as the lot size helped me to manage risk, it also guarantee me of only a little capital.
Total account value went from $10 to $13.51
QUESTION 4
In as much as TRX is a good coin for both long and short term investments due to its several features which includes fast transaction rate, low charges, etc. I obviously have no plan of keeping the coin for a long time.
According to the above analysis, I already marked out the price at which I took profit and exited the market.

QUESTION 5
In as much as TRX is a good coin for one to invest in, we shouldn't nullify the fact that the cryptocurrency world is full of uncertainties and very risky. For this reason, I will not be advising anyone to buy as everyone is required to carry out their own research (DYOR) and buy at their own risk for I am not anyone's financial advisor.

CONCLUSION
This task was carried out using my MT5 margin trading app where I took a buy position on TRX|USDT PAIR using a lot size of 1000.00.
After carefully applying all the necessary precautions, I took a buy position using a strategy which was inspired by Professor @Reminiscence01, and as expected the trade was a success.
I'm glad to be a part of team #Reminane


.jpeg)
