Steem/USDT Order Book Trading – Mastering Market Liquidity Strategies
Hello my dear friends, i hope all of you fine. This me your very own Faran Nabeel. Today am here back on steemit crypto academy to participate on this week challenge.
Question 1: Understanding the Order Book in Steem/USDT Trading
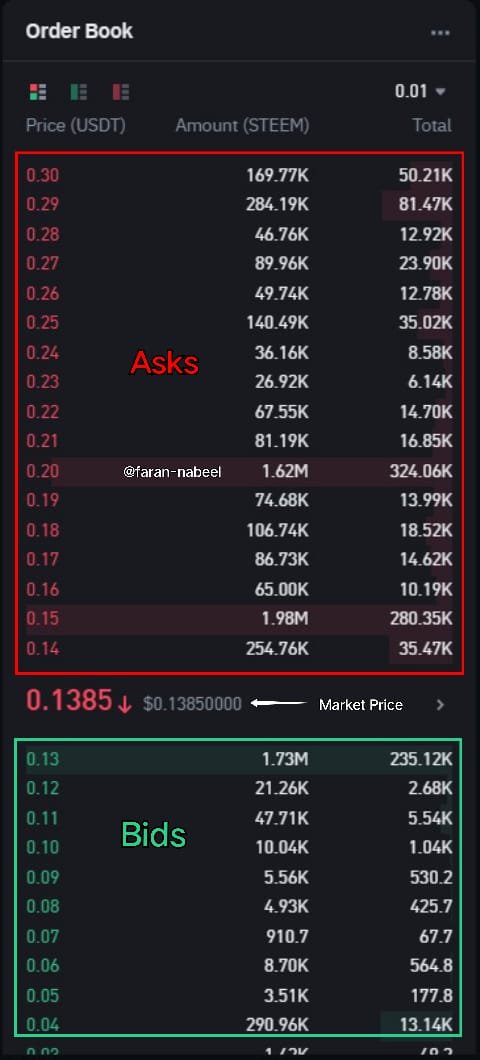
The order book is the real time list of buy and sell orders for a specific trading pair like Steem/USDT in cryptocurrency trading. It show the two main components to trader,
 |
|---|
Bids: This is the buy orders represent the prices which buyers are willing to pay for the Steem. For example, if the bid is about $0.48, buyer hope to purchase Steem at this or below this price.
Asks: This is sell orders show the prices which the sellers demand for Steem. If a ask is at $0.50 price, sellers aim to offload Steem at and above this price.
Orders are rank by price, with a highest bid and a lowest ask display at the top. The difference between this prices is called spread. A narrow spread usually means the high liquidity means to say that easy to buy and sell quickly.
How It Works
Here is the two ways to describe that how it will work and how trader can take benefit from this, first one is Market Orders, Execute at the best available price such as buying Steem immediately at lowest ask. And secound is that the Limit Orders, Set a specific price. For example, a buy limit order at $0.50 and wait until seller matches that price.
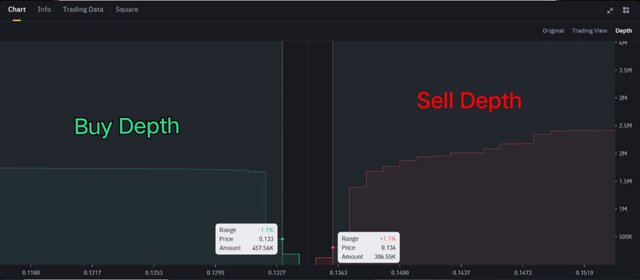
The order book also shows market depth which describe how many orders exist at the each price level. This helps to identify support which means price floors with many buyers and resistance which describe the price ceilings with many sellers.
Why It Matters for Traders
- Transparency: See real time supply and demand areas.
- Price Prediction: Large buy and sell clusters hint at future price movement.
- Slippage Control: Big trader split the orders to avoid moving price.
- Sentiment Analysis: More bids and than asks? Bullish sentiment can rise.
The order book is efficient tool for Steem/USDT traders, offers thentransparency into real time supply and demand areas. By analyze the large buy and sell cluster, We can gain clues about potential price movement, become mastering in order book make sure to us to make inform decisions, reduce risk, and capitalize the market opportunity efficiently.
Order Book vs. Traditional Technical Analysis (TA)
Here is the quick difference between Order book and traditional technical analysis, It provide comparison between both and describe that how order book different from traditional technical Analysis.
| Order Book Trading | Technical Analysis (TA) |
|---|---|
| Focus on current buy and sell activity. | Rely on historical data such as charts, indicators like RSI. |
| Reveals the immediate liquidity and order flow. | Predict the trends using patterns like head and shoulders. |
| Help to spot hidden support and resistance. | Identify long term trends and entry/exit point. |
Key Takeaway:
Order book offers the live snapshot of market sentiment, while other side TA provide the context from past behavior. As smart traders combine both, and use TA for strategy and the order book to time trade and confirm signal.
Example: If TA suggest the Steem price breakout, check order book for strong buy pressure and thick bids to confirm the move. I would like to discuss further.
Question 2: Market Depth Analysis and Order Flow
Market depth is valuable tool that display pending orders on trading platform at various price levels. It provide us a snapshot of where buyer and seller are placing their orders for trading. When many orders are place at specific price, that level can act as a support if this buy orders or as resistance if they are sell order. means to say that a heavy cluster of buy orders can stop the price from falling more, while a large number of sell orders can prevent the price from rising.
Traders use market depth to identify potential turning point in the market. By study the order book, they can plan and find entry and exit point. For example, a large concentration of buy order shows that many trader are willing to purchase at this price. This area then become support zone. Alternativaly, if level show many sell order, it can signal resistance, means that the price may struggle to push higher. This view of pending order is key in set initial expectation about where the market might reverse.
Order flow analysis go with a step further by focus on actual trades as it happen. Instead of just look at where orders are place, order flow track the execution of this order in real time. It show not only the volume of trade but also the speed at which they are fill and whether there are any change or cancellation. This data reveal the true market sentiment at any given moments. For example, if the large buy order are rapidly execute, it indicate the strong buying interest and suggest that the price could continue to rise. On the othe side, a surge in sell order can indicate increase the selling pressure, potentially lead to the price drop.
In this table compare the market depth and order flow:
| Market Depth | Order Flow |
|---|---|
| Displays pending order at different price level. | Show the real time execution of trade. |
| Use static data to highlight where order are place. | Use dynamic data to record fill and cancell order. |
| Help to identify support through cluster of buy order. | Indicate the strong buying pressure when large order are quickly fill. |
| Reveal resistance through cluster of sell order. | Reflect the selling pressure when many sell orders are executed. |
| Aids to plan trade entry and exit by spotting the order clusters. | Assist in adjusting strategy based on the live trading activity. |
Combine market depth with order flow analysis, trader gain the comprehensive view of market. The order book static information shows potential price barrier, while live order flow confirm the market current direction. This dual approach help to trader to make more inform decisions, manage risks betterly, and time their trade more accurate. Using both tools together lead to clear understanding of market behavior.
Question 3: Identifying and Reacting to Large Orders
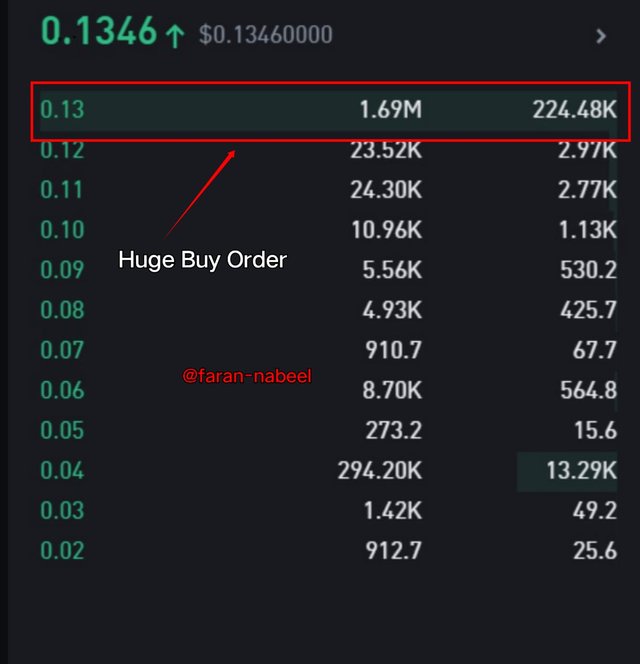
As we know that large buy and sell orders, often as “whale orders,” can powerfuly influence market behavior by showing a significant interest at the specific price level. In below picture , we see the highlighted buy order of considerable and huge size, which indicate that someone is prepare to purchase large quantity of the asset at specific price point. This large buy order can act as the form of support, suggest that the price will not drop below this level easily because of strong demand.
When trader notice the whale order, they can adjusting their strategies. Some can see the large buy order as signal that market is likely to rise from that price, prompt his to buy in an upward movement. Others can see it as opportunity to sell at price they considered favorable before the order is fill and the price move higher. Whale order can shape the short term sentiment and cause the ripple effect all across the market.
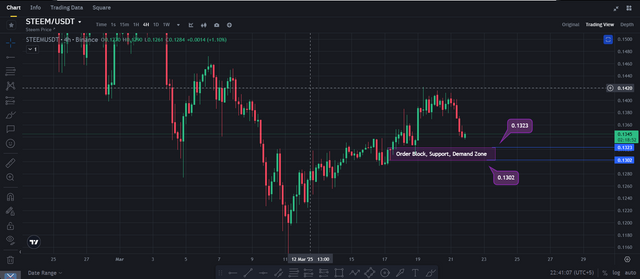
As if trader see this situation to confirm his story, he can move to chart and Analysis his understanding for more confirmation, for example, he can find the strong support near this area. Here is the example as at the price of 0.1300 to 0.1323 is a strong demand zone which shows the price can move from this area. and also user can place short position untill the price came into this level.
To optimize the trading strategy, trader can position his buy or sell order around this levels, aim to benefit from the expected price bounce and resistance. It is also the crucial to watch how quickly the whale order get fill. If it is fills quickly, it can indicate the robust demand, strongly leading to strong upward price move. on the other side, if the order sit unfill for a long time and suddenly disappear, it can be tactic to manipulate the market in other traders.
In last, large orders may acts as a magnets, attracting the price action based on level of demand which they represent. By monitoring this whale orders, user can gain insights into market psychology, adjust the entry and exit point of the position, and improve the overall trading results.
Question 4: Order Book-Based Trading Strategy
An order book base strategy rely on analyzing real time buy and sell orders to identify entry and exit points. Below is the step by step approach to Steem/USDT which i personally use for my trading, and it covers all the points which I need to take a best trades with high success ratio.
- Initial Market Analysis
By review the chart like Steem and the recent price action, and overall the market sentiment. This background research provide me a context on volatility and fundamental drives that might affect my trade.
- Identify Key Levels
I use historical price data to point out the major support and resistance zones. This levels typically align with area where large order have previously cluster, suggest the strong buying and selling interest.
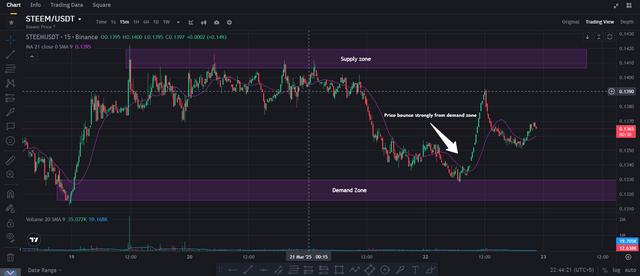
Here I finded the demand zone and we can see the price quickly bounce back from this strong zone, here is the strong buy order placed as i see in the order book.
- Monitor the Order Book
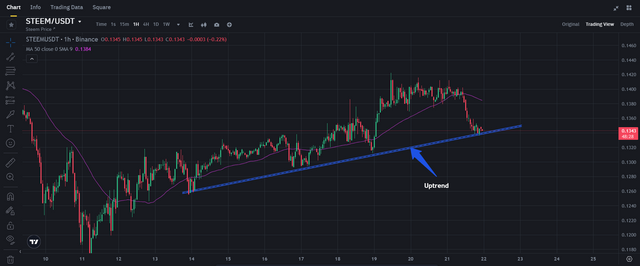
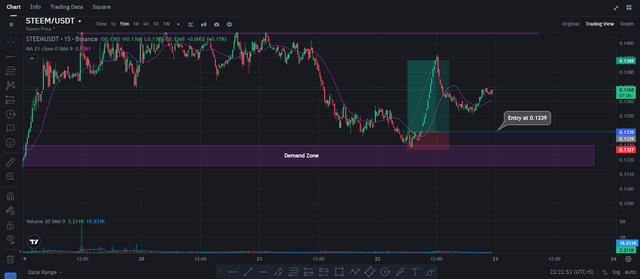
I closely watch the order book for large buy and sell orders that can signal reversals or breakouts. I find finally find the large buy order at the $0.13 of steem and we can also check the support zone here as we see in the previous section here is the strong level at this price which push the price from $0.13 and the price boom from this level.
- Entry Points
Support-Based Entry: If trader see buy wall forming around the known support level, consider placing the limit order just above it. I also place my
- Exit Points
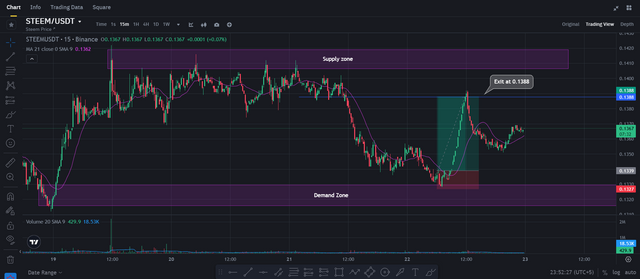
Profit Targets: We can Set take profit order near historical an below resistance levels and where significant sell presure can appear. And I set my target below the minor resistance and we see the price exactly move from this level.
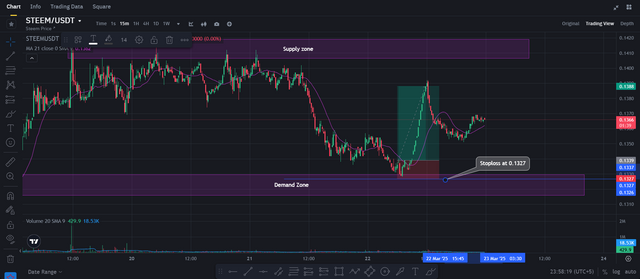
Stop-Loss Placement: I place stop loss order below recent support to ensure the minimal damage if the market reverse from this level. I place my sl at the price of $0.1327 as give some space from support level to secure my position.
Liquidity Considerations
Prioritize best trading pairs with good volume to avoid spread and slippage. Higher liquidity provide help to execute orders more predictably and perfectly. If we talk about steem/USDT, it is not bad for trading, we can trade on steem pair with usdt and it has enough qualities to trade it.
Risk Management
I always preder to take limit risk to small percentage of my trading capital per position. and I suggest to all the trader create prope risk management to secure their capital and use only 1% of their whole capital for a single trade, Employing trailing stops to protect the gains and regularly review the strategy tocover the market conditions.
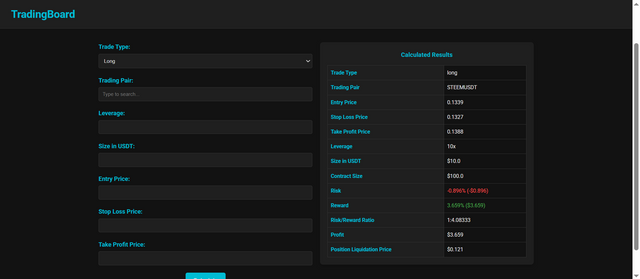
Here is my trade risk management and and I calculated my risk reward ratio before entering in the position and I set 1:4 ratio for my this trade, actually this is my own tradingboard calculator to calculate the risk reward ratio.
| Trading Pair | Steem/USDT |
|---|---|
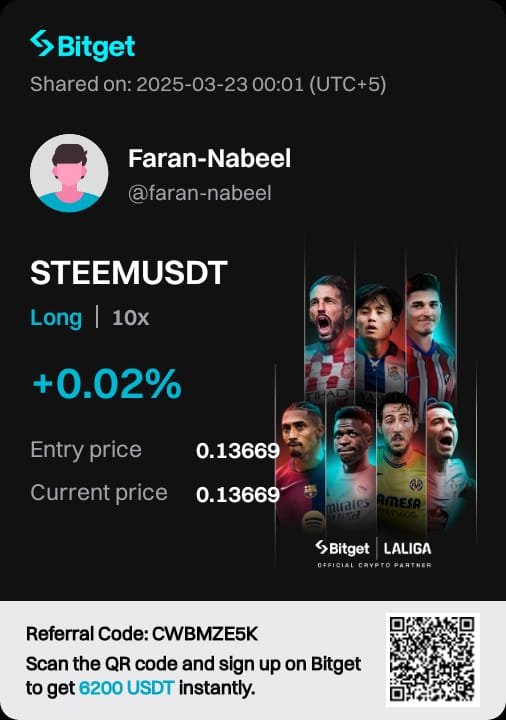
| Trade Type | long |
| Entry Price | 0.1339 |
| Stop Loss Price | 0.1327 |
| Take Profit Price | 0.1388 |
| Leverage | 10x |
| Size in USDT | $10.0 |
| Contract Size | $100.0 |
| Risk | -0.896% (-$0.896) |
| Reward | 3.659% ($3.659) |
| Risk/Reward Ratio | 1:4.08333 |
| Profit | $3.659 |
| Position Liquidation Price | $0.121 |
By using this technical insights with real time order book analysis, every trader can refine entry, exit, and risk control, have aim for more consistent performance in the market.
Question 5: Real-World Order Book Case Study
A trader named Ali carefully monitor the order book and identify the significant buy order from whale at 0.25 USDT and a sell wall at the price of 0.30 USDT, set the stage for two strong outcomes. In such scenario, the large buy order hold firm as buyer step in to defend the main support level. Ali enter a long position at 0.26 USDT price, he is confident that the support will continue to protect the specific price. As the market respond him, the price gradually run toward the upper resistance, and Ali’s take profit target of 0.29 USDT is reach. Through this upward movement, Ali continuously monitor the order book and adjust the stop loss with trailing mechanism, to locking in profit and capitalize on bullish momentum.
In other side, a negative scenario unfold if the buy order failed to sustain the market support. Should be the aggressive selling pressure come into the support, the price should had break down quickly, trigger the trader’s stop loss order at 0.24 USDT price. In this situation, the trader face unexpected loss compound by slippage due to the sudden liquidity drop and heigh volatility.
Recognize this types of challenges, the trader can improve his approach by employ more dynamic stop loss strategies that adjust in the real time during period of increasing the volatility. Enhance monitoring through real time alerts can allow for quick response to changing order book condition. Regular review of past trades to refine entry and exit poins are also important to ensure that the trading strategy evolve with market behavior. By considering both of the positive and negative results traders can better prepare to adapt and optimize his strategy under various market conditions.
Note: All the screenshots have been taken from Binance & My own trading dashboard.
Now I do like to invite my friends, @sualeha, @suboohi, @seh-rish, @chant, @josepha and @wilmer1988 to participate in this challenge.
Regards,
Faran Nabeel

Upvoted! Thank you for supporting witness @jswit.
Great @faran-nabeel
You have really made this post bot very nice I like it and explain it in a way that is very easy to understand.
Always keep up such nice posts, thanks.
Thank you so much