How to Trade Cryptocurrencies Profitably Using TD Sequential - Steemit Crypto Academy | S4W8 | Homework Post for @reddileep
Good day, to every member of the cryptoacademy


1-Define TD Sequential Indicator in your own words.

Indicators are essential for trading in the cryptocurrency space, and I am sure it has made so many people who they are in the market, though last week we discussed about fundamental and technical analysis. But in today’s assignment, we will be looking at on key indicator that is widely used in the market
The TD Sequential indicator: We know the market moves in 3 directions, which are the uptrend, downtrend, and the ranging. The most important one that traders are normally looking for is the uptrend and downtrend because of the volatility of the market. But when a trend changes either from uptrend to a downtrend or from downtrend to uptrend it is normally called a reversal. Which sometimes, traders normally wait for also.
This TD sequential indicator is simply used to know when a reversal is about to happen or it is about to end and it also is used to predict correction by counting candles. It was developed by Tom Demark, who also was a Technical Analyst. It is a trend-based indicator. You should also know that this reversal or exhaustion happens in any time frame but you see its true power in a larger time frame.
The indicator is made up of numbers below and above the candlestick and are in downtrend and uptrend respectively, it is made of two phases which are the setup and the countdown phase


2-Explain the Psychology behind TD Sequential. (Screenshots required)

Indicators are a highly important tool to be used in the market as a technical analyst, to use indicators to make profits, one needs to understand how the indicators works and all the principle and instructions that are needed to follow. Knowing the functionality of the indicator is the key to making sufficient profit in the crypto market. For the TD sequential
There are two important things that makes up the TD sequential and they are as follows:
- Setup phase
- Countdown phase
These two listed phases are used to determine the trade reversal in the market, you should also note that TD sequential indicator is not only used in the cryptocurrency market but forex market and also stocks market, and even all the available markets.
For both phases, they make use of the candlesticks, which are very important for determining the Setup and the Countdown Phase.
The Setup Phase
The Setup Phase consists of the sell setup and the buy set up in the chart,
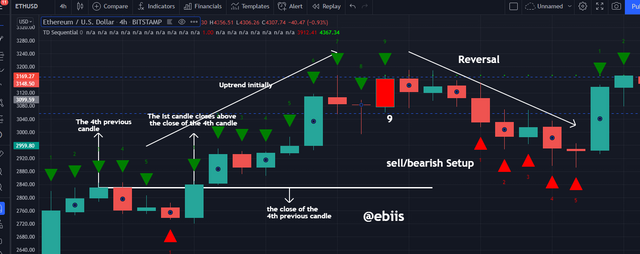
For the TD Sell set up to start and finish you will have 9 candles formed and all of them will be higher than it previous one in ascending order, this is a clear indication of sell and it must be on an uptrend and with time the trend will be weak and it is the time to for reversal. More explanation will be given it in the next question.

For a Buy Setup
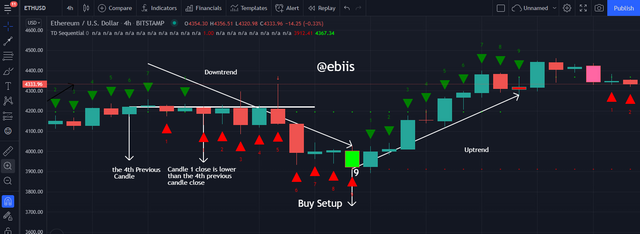
The Buy setup also buy and finish with 9 candles which are formed before the candle and all of them are formed before the 9th candle and they are all lower than the previous candle, and it will be on a downtrend, with time the trend will be weaken and the indication of the weakening trend will be spotted by the TD indicator.
More explanation will be done on the next question.

The countdown Phase
The next phase after the setup phase is called the Countdown phase, the countdown phase occurs after the setup phase that is completed with the formation of the 9 candlesticks, but if the 9 candlestick does not form the complete reversal, the is where the countdown phase will come into play. The countdown is made up of 13 counts. The countdown phase is the second phase of reversal after the failure of the setup phase, but if the countdown phase also fails, the chances of reversal occurring will be too high.

3-Explain the TD Setup during a bullish and a bearish market. (Screenshots required)

Bearish TD Setup
This is similar to the sell Setup, and the sell setup occurs after an uptrend in the market. These conditions must be might for us to say that a bearish TD setup has been formed.
- The price of the market should firstly be on the downtrend
- Look for a bearish candle that is being formed on a larger time frame.
- Immediately, after the formation of a bearish candlestick, should come to a bullish candlestick, which can be referred as Price Flip.
- From that bullish candle formed, the close of the next candle formed should be above the close of the bullish candle, after the previous four candles from that candle.
- Add the TD sequential indicator.
- Then you can start the counting, your number one candle should be the first candle above that candle.
- This will also repeat itself from number 2 to 9. if it is proper, you need to start counting from the beginning until you get a straight 9 candles which are arranged in ascending order.
- You should make sure that, if the candles are looked backwardly, from each of those candles, you will notice that the close of the candle below is closed below the candle that has the number.
- If this repeats itself, for 8 or 9 times, then we can observe that the market trend will be weak and be ready for a reversal.
- This can lead to a reversal or a correction
- You can confidently say that the bearish/sell setup has successfully been formed.

Bullish TD Setup
This is similar to the buy Setup, and the buy setup occurs after a downtrend in the market. These conditions must be might for us to say that a bullish TD setup has been formed.
- The price of the market should firstly be on the uptrend
- Look for a bullish candle that is being formed on a larger time frame.
- Immediately, after the formation of the bullish candlestick, should come a bearish candlestick, which can be referred as Price Flip.
- From that bearish candle formed, the close of the next candle formed should be below the close of the bearish candle, after the previous four candles from that candle.
- Add the TD sequential indicator.
- Then you can start the counting, your number one candle should be the first candle below that candle.
- This will also repeat itself from number 2 to 9. if it is proper, you need to start counting from the beginning until you get a straight 9 candles which are arranged in descending order.
- You should make sure that, if the candles are looked backwardly, from each of those candles, you will notice that the close of the candle below is closed above the candle that has the number.
- If this repeats itself, for 8 or 9 times, then we can observe that the market trend will be weak and be ready for a reversal.
- This can lead to a reversal or a correction
- You can confidently say that the bullish/buy setup has successfully been formed.


4-Graphically explains how to identify a trend reversal using TD Sequential Indicator in a chart. (Screenshots required)

Downtrend Reversal
When you see a particular that is currently going on, let say for this first illustration, we will be looking at an uptrend reversal. From the chart below, you can see the uptrend in 4 hours time frame of the BTCUSD chart. For you to properly identify if the trend is active or weak, you should add your TD sequential indicator. And from the chart you can notice that the price keeps forming a higher high repeatedly, it is being indicated with a white arrows
You can see the point higher low that is marked A and it also has 1 as the number of TD sequential. You will notice that at a point the market moved up faster and led to the sequential forming the number 1 to 9 and in the candle formation, every next candlestick closes above candlestick, and this happens from the first one to the ninth candlestick. When should also note that after the 4th candlestick, the next candles should close above that 4th candle? Once it gets to the number and the next candle that is formed, closes lower than the 9 candles, we should be ready for bearish reversal

Uptrend Reversal
The TD Sequential indicator can also be used to identify when an uptrend is about to begin, the can be achieved by seeing and knowing all the work principles of the TD indicator. Which can see that number has been found or formed after a series of downtrend numbering. this is achieved by a candle on a downtrend and the candles are counted by the TD sequential indicator. The next candle closes below the previous candle, it should be done repeatedly for the next 9 candles sequentially without any of them breaking the rule. If the rule is broken, the counting will start from the beginning. Until the completion, which should be the 9th, at the 9th reversal mostly happens.


5- Using the knowledge gained from previous lessons, do a better Technical Analysis combining TD Sequential Indicator and make a real purchase of a coin at a point in which TD 9 or 8 count occurs. Then sell it before the next resistance line. (You should demonstrate all the relevant details including entry point, exit point, resistance lines, support lines, or any other trading pattern such as Double bottom, Falling wedge, and Inverse Head and Shoulders patterns.)


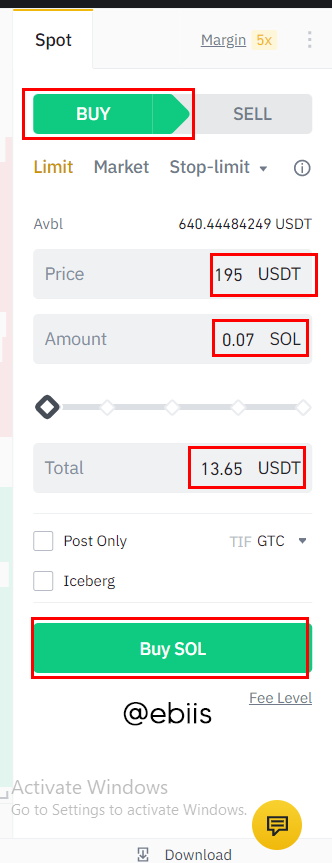
From the SOLUSDT chart in 4 hours time frame, we can see the support and resistance that the market has being moving within and also the inverted W that it has formed. So I went to the Support and that was the point where our number 9 was formed, so it was a clear buy entry for me. and I bought.


So after a while, the trade got to its resistance and the TD number 9 was also formed at the resistance, I placed a sell order


this is the result I got so far from the trade

In conclusion, I have truly confirmed the authenticity of the TD sequential indicator, when gotten properly, you are sure of leaving the market with a huge profit. i can satisfy from the little trade that I have taken in this assignment. I want to also thank professor @reddileep
Cc: @reddileep