"STEEM's Price Puzzle: Between Bearish Echoes and Bullish Whispers"
As members of the Steemit community, understanding the dynamics of STEEM's price can directly impact how we engage with the platform, whether through content creation, curation, or investment. This analysis aims to provide a comprehensive look at STEEM's recent price action, offering insights into the current market conditions and potential future movements. Whether you're a long-term holder or an active trader, this information can help guide your strategy on Steemit.

Price Action
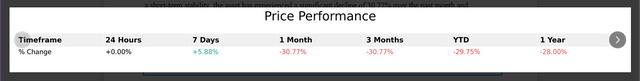
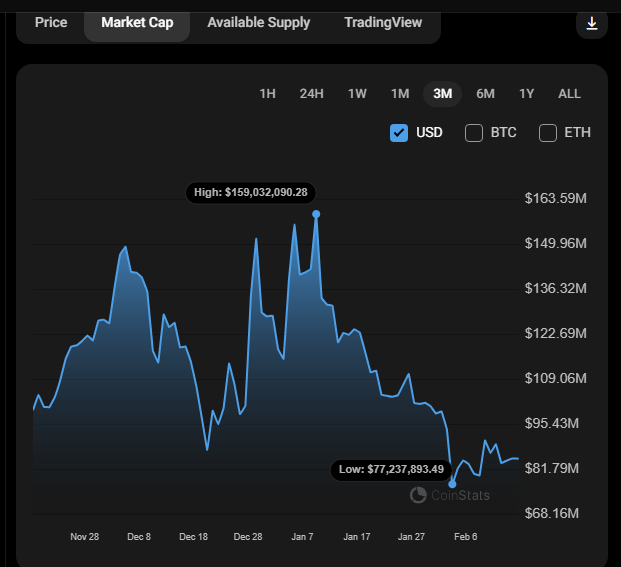
The price of STEEM has experienced fluctuations but remained mostly within a stable range. Despite this short-term stability, the asset has seen a significant decline of 30.77% over the past month and year-to-date, and a 28.00% decrease compared to one year ago, reflecting challenges in maintaining market capitalization.
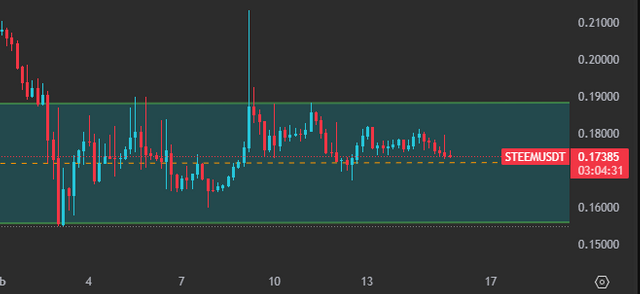
Support levels for shorter time-frames are observed around $0.155, with resistance levels near $0.187, indicating a moderate level of volatility. On a daily time-frame, the price is at a critical point where both significant opportunities and dangers are apparent. Professional traders and investors often choose this price zone for accumulation, but it could also be another chance for redistribution as signs of rising haven't been seen yet.
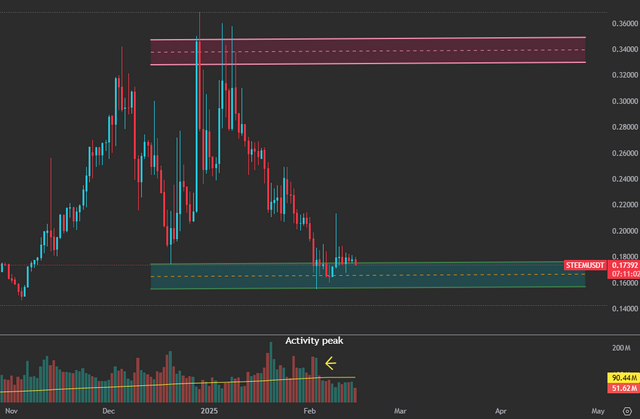
The current downward trend, starting from January 6, appears stronger than the previous one from December 4 to December 19, 2024. STEEM has been volatile, with prices moving around $0.18, suggesting either a potentially new uptrend or a very active phase in an existing one. However, the price seems to be rejected from moving out of its recent range, by not having consumed enough time or volume to establish a new level.
STEEM is experiencing a recovery from a slump, but it's a slow advance without clear bullish momentum. The downtrend appears to be gaining length, while uptrend movements are shorter, suggesting bearish forces are stronger. No clear reversal pattern has been established yet, and the market is still in a testing phase for any potential turn or trend continuation. Changes in price are gradual, indicating cautious or lack of urgency in market participants' actions. Loss of supply often leads to price increases, but there's no clear sign of supply drying up, although observing high volumes could indicate supply being absorbed gradually.
Volume
Trading volumes show periods of increased activity around price peaks and troughs, reflecting fluctuating pressures, and periodic spikes in trading activity. Currently, volume appears subdued, indicating a neutral sentiment with potential sell-side pressure.
The number of trades has significantly increased, up by 502.12% in the last 24 hours, suggesting a high level of trader engagement. Continued high volume might signal sustained interest or a push towards higher prices. However, a rapid decrease in volume could indicate that the current momentum is waning.
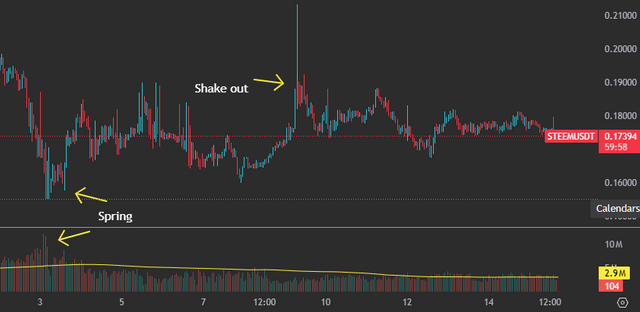
There was spring activity on February 3 and a shakeout on February 9; the market volatility might signal another one forthcoming. If the spring were successful, it might lead to more stable price action, since weak hands are out. Otherwise, more volatility could be expected.
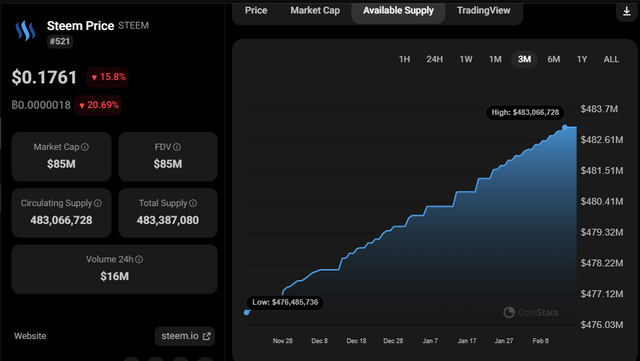
With STEEM's market cap at around $85M and a significant number of holders (12,345 reported), the token appears to be in a strong position where holders are likely engaged rather than just speculative. However, one single address holds about 30% of all available coins, and there's been a slight decrease in the number of holders, suggesting some distribution is occurring.
Recently, the token has been held by numerous speculative traders without significant profit realization, indicating a lack of strong conviction in its movement. However, the current volume spike is notably higher than recent trends, which may suggest the supply side might be mistaken as it lacks the vigor of past rallies.
Average
The average moves slowly, suggesting the trend might not be fleeting. It's below the dead center, indicating a technically bearish position. Also, closing prices are towards the bottom of the day's range, which is another bearish sign.
Bid-Ask Spread
The spread is relatively wide with diminishing volume, suggesting more activity but less liquidity, which indicates neither a bullish nor bearish signal.
Activity
Compared to the last trend, activity is low, suggesting a weakening technical condition, being neglected by traders, and thus any recovery might be interrupted. The activity is out of sync with both price and volume, indicating a lack of clear market direction.
Volatility
Volatility is decreasing along with volume, suggesting absorption or consolidation.
Leverage
Leverage is moderate, not signaling extreme fear but not confidence either, suggesting potential for upward movement if sentiment shifts. Remember, a high leverage ratio would increase risk, potentially leading to price drops.
Sentiment
Overall, STEEM exhibits a predominantly neutral to bearish sentiment across various timeframes. While short-term conditions are stable with no clear bullish or bearish signals, medium to long-term analyses point toward downward momentum.
In social media platforms, bullish talk is scarce, reflecting a bearish market sentiment. The market seems dominated by public sentiment rather than large operators or inside interests. Traders display more anxiety than eagerness, leaning towards selling rather than buying. The market mood is one of caution and fear, with hopes for recovery tempered by concerns of further decline.
This level of fear might end in panic, but also historically, such low sentiment scores have often preceded significant bullish reversals, as fear can lead to capitulation or selling off at the bottom, setting the stage for recovery. Also, institutions and professionals often enter the market during low sentiment periods, following the strategy of buying when there's "blood in the streets."
Conclusion
The immediate outlook suits active traders and those focused on short-term price movements. However, for medium to long-term horizons, the theme is one of cautious neutrality, potentially shifting to bearish unless significant catalysts reverse the trend; In this case, do to not lose the opportunity, for taking a position. Thus, it's crucial to stay vigilant for any technical or fundamental changes that could alter these patterns.
Our analysis suggests a market in a phase of consolidation or potential bottoming out, with traders cautious and looking for clearer signs of a trend direction. Thus, for Steemit users, these insights can inform decisions on content creation, curation, and when to engage with STEEM through trading or holding.
"Disclaimer: This analysis reflects personal insights based on historical data and current market indicators. The crypto market is highly volatile; always conduct your own research and consider your risk tolerance before making investment decisions.
Share your thoughts or insights in the comments below – how do you interpret the current market?"