[Heikin-Ashi Trading Strategy] -Steemit Crypto Academy | S4W2 | Homework Post for @reddileep

The term Heikin-Ashi was coined out from it developer Munehisa Homma, who is a Japanese in the 1700s. Heikin-Ashi is a japanese language meaning Average Pace. It simply mean the average-pace of price in a market.
Heikin-Ashi normally is used to display the trend that is usually dominant by smoothing out the price. It is also used to filter out some of the noise in the market. One way that the Heikin Ashi candlestick differs from the traditional candlestick which normally focuses on High, Low, Open and Close of the current time period, the Heikin-ashi mostly uses some data from the previous candlestick, Depending on the time frame you are using, if you are using a 1 hour candlestick, it will get it information or data from the candlestick that just formed previously. It allows you to stay in with the trend. Heikin Ashi mostly uses formula to determine its open, high, low and close.
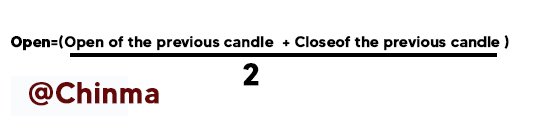
With the help of the above formulas you can calculate the average values of the previous candle Open, High, Low and Close
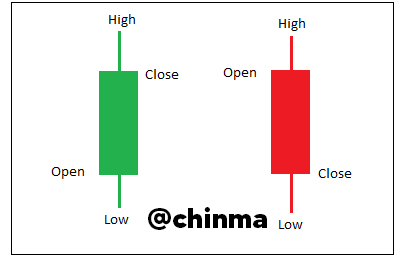
A typical example of a Candlestick

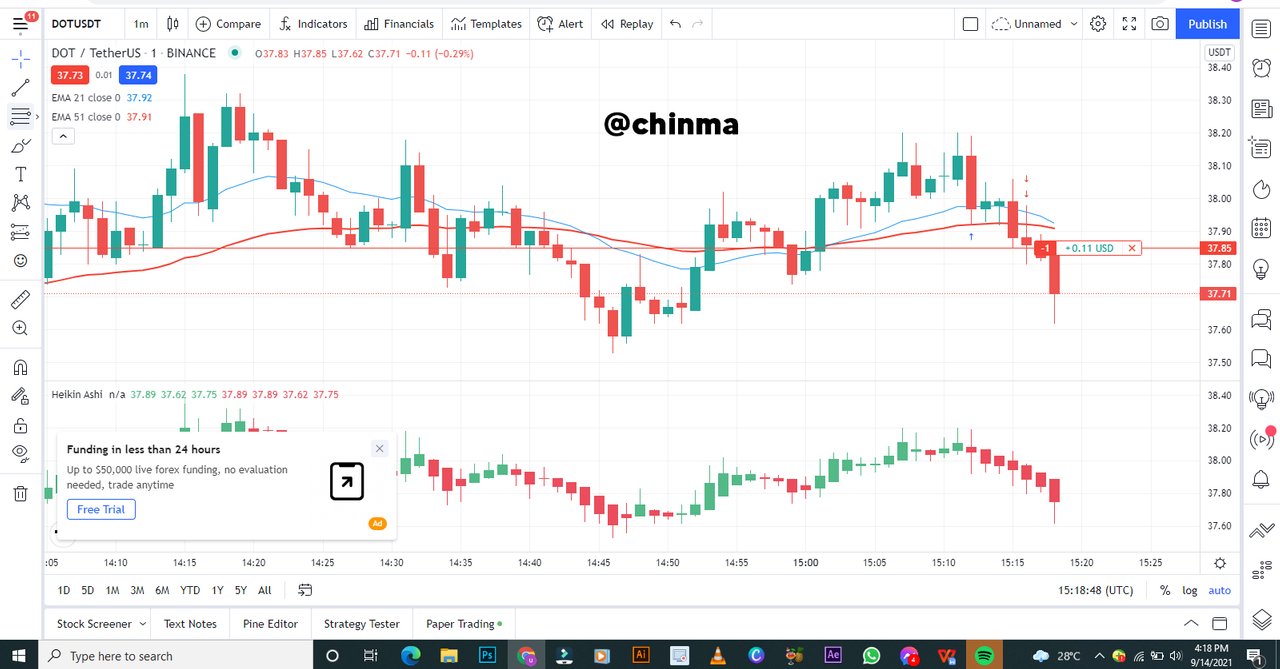
An Example of a Heikin Ashi Chart

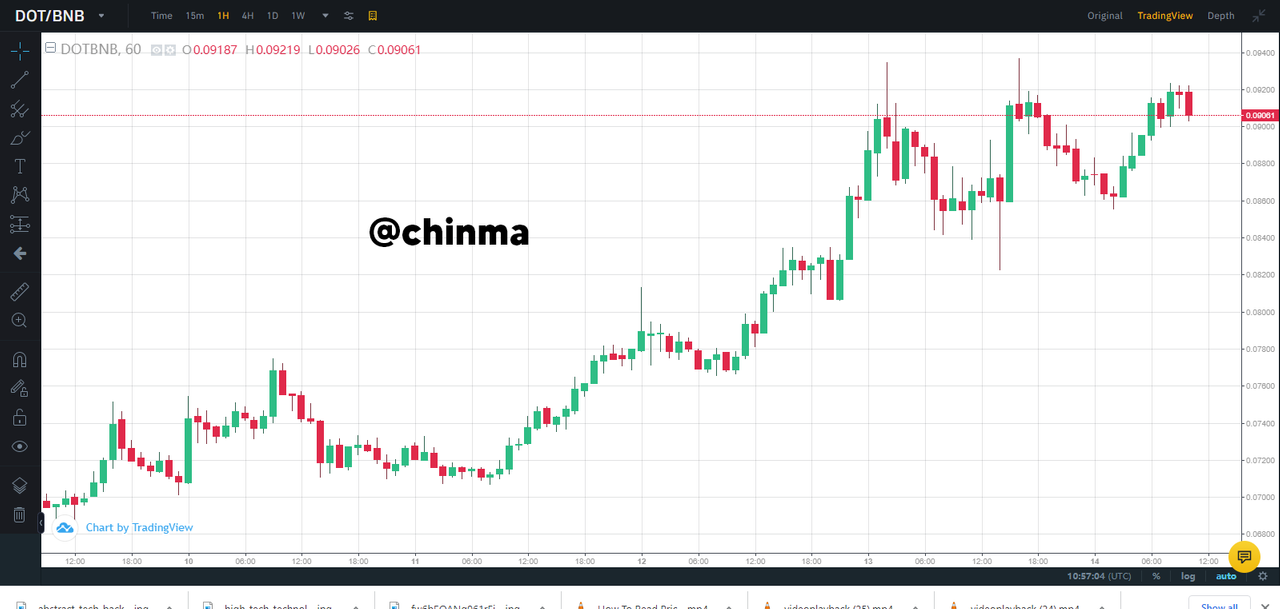
An Example of a real chart
The heikin ashi candlle chart looks like the real candles charts but there’s a difference
- A candlestick chart always shows you a literal or raw information of the prices of the market while the Heikin Ashi chart uses the Average value of the Normal candlestick chart by calculating them with the formulas above.
- Most of the candlesticks price are in a very concentrated area while in Heikin Ashi there is a lot of space, between, it seems the candles are arranged.
- A candlesticks also shows many volatility which makes them very noisy. While Heikin Ashi removes most noise from the chart, thereby making it the trend very smooth.
- In a candlestick chart, each candle have for different prices which are open, high low and close, each candlestick that is formed after has no relationship with the one that is previously formed.but with the heikin ashi candlestick, each candlestick is calculated using some information from the prevoius candlestick.
Open price= Average of the open and close of the previous candlestick
High price= Is gotten from the one of the high, open and close price of which has the highest value
Low price= Is chosen from the one of the high, open and close price which has the lowest value.
Close Price: is the average of the open,close high and low prices.
- In the traditional candlestick chart each candle is independent, and there is no relationship between it and its previous candlestick But In Heikin Ashi, each candlestick is usually calculated from the information of the previous candlestick
- The candlesticks in the Heikin Ashi chart looks very neat and organized, compared to the Traditional Candlesticks which looks very scatter.
- Up candlestick are formed in the traditional chart by the closing price being above the opening price while in Heikin AShi Chart, the Up Candlestick is formed by the closing price being above the midpoint of the previous candle.
- Down candlestick are formed in traditional chart by the closing price being the below the opening price while the In Heikin Ashi chart, The Down Candle is formed by the closing Price being Below the midpoint of the previous candle.
- From the chart, I noticed that the traditional candlestick has lots of tails/wick while the Heikin Candlestick has few tails depending on the candle, if it is a bull candle, the tail mostly is at the top but if it is a bear candlestick, the tail is mostly at the bottom.
This a typical example of a candlestick, but as I have said before, that in Heikin Ashi, the Open, High, Low And the Close are all being calculated, the calculations are gotten using specifics formulas. The formulas are below
- For you the calculate the open in the Heikin Ashi chart, It is simply the average of the Open And Close of the previous candle .
- TO calculate the High of the Heikin Ashi, The maximum value of the Open and close of the current is needed, the highest between both of them takes the High.
- To calculate the Low of the Heikin Ashi, The Minimum value, of the open and close of the current price is required and the lowest value will become the Low of the Heikin Ashi.
- To calculate the Close in the Heikin Ashi, The Average of the current open,high, low and close is used or simply it can be the summation of the Open, High, Low, and Close divided by 4, this will give you the Close of the Heikin Ashi Close.


Initailly, in Question 1 and 2, I have told you guys that the Heikin Ashi is also good to determine good and clear trend compared to that of the traditional candlestick chart.
So let’s us Carefully do some in depth expalnations.
Using Heikin Ashi in Getting the Trend.
In this Heikin Chart below of SILUSDT in 5mins time frame, you can see that the downtrend are very clear, with all the wicks at the bottom, you can hardly a bearish candlestick with yhe wick above the candle and if they are, they are very few. Until the point where the inverted hammer candle was spotted that made the downtrend to consolidate for a small time before it continue to fall .

In the Uptrend using the Heikin Ashi chart, In the DOTUSDT chart in the 5 mins time frame, An uptrend was spotted, it is very clear and organized with all the wick of the bullish candlestick above which indicates that the trend is in the uptrend. You can rarely see the Bearish candlestick in the uptrend using the Heikin Ashi. Until where the Morning star was formed that led to the diversion and the market starting to Range for some period of time.

The Heikin can also be used to indicate a clear buy signal, The Buy signal can be seen after an area of indecision in the market, if the market is been opened by a bullish candlestick. We can be ready for a clear and lengthy buy. For the chart below, it can be clearly seen. In the Heikin Ashi chart of DotUSDT in the 15mins time frame, you can clearly see the point of indecision with some many wicks above and below a particular candlestick and have happened in several candles, after that a doji candlestick indicating that the bulls are ready to take the market showed up, and we can see from there that the buyers were dominating the market. That is a clear signal for the buyers.

The Heikin Ashi Candlestick Chart is good for transaction but not 100% because I have seen that there are time the market reverses without proper information and if you are not monitoring your account you might loss a lot of money. I believe proper risk management should be employed while using the Heikin Ashi candle. But the introduction of some Certain indicators will make it more perfect to be used and your profit can be easily secured. Sometimes, the candlesticks that indicates reversal are not always true, so I think that indicators will play more role in the assist of the usage of the Heikin Ashi.
Trades were taken, using Heikin Ashi, the 55 EMA and the 21 EMA. Below are the trade and the reason why I took the trades at such positions.
The SELL order,
I took a sell order trade on a DOTUSDT in a 1min timeframe, using the Heikin Ashi, EMA 55 and EMA 21. Looking at the chart, the traditional chart was at the top while the Heikin Ashi was at the bottom. The Heikin Ashi was on a downtrend producing more of bearish candlestick, the both EMAs served as an essential resistance and to confirm further the downtrend, the 21 EMA, was about to cross the 55 EMA, which was a clear indication of a sell order, so I placed my sell order and immediately I started making my profit
Here is some profit that I made before taking a Screenshot

The Buy Order,
On a chart of EGLDUSDT on 5mins time frame, I executed a buy order, using the Heikin Ashi, 55 EMA and the 21 EMA. The EMAs served a very strong support . As the price touched the support on EMA 21, It started to go back. The Heikin Ashi was on A uptrend. It started giving me huge profit in a short time

I have Already made $2 in a short time using the Heikin Ashi strategy.

In conclusion, Using the Heikin Ashi is a very great secret in making good and cool profit in the cryptocurrencies market, The Heikin Ashi which helps to smoothing the noise and shows you a clear trend which every trader is looking for is a tool to be used in the cryptocurrencies market, if you need to be successful. And the addition of The EMAs made it more outstanding. Try using this strategy and see yourself be a successful trading. For me I have already started using it. Thanks, Professor, your first topic has simplified a lot in the cryptocurrencies market. I really appreciate your effort in this topic.
Cc: @reddileep