SLC-S23/W2 | Technical Analysis Strategies for Crypto Trading

Hello everyone! I hope you are all doing well and enjoying life with the blessings of Allah Almighty. I am happy to take part in the exciting challenge hosted by SteemitCryptoAcademy community . So, without any further delay, let's dive right in! Shall we ? ........, Okay , Okay😊! .
Question 1: Foundations of Technical Analysis |
|---|
Crypto markets behave more like a unpredictable roller coasters by showing price movements which switch between increases and decreases and horizontal fluctuations. But technical analysis? yes such analysis works as a directional instrument which enables market traders to understand price movements while maintaining increased certainty.
The primary factor involves detecting market trends. The market demonstrates a tendency to move in systematic ways rather than producing random movement. Trading based on uptrends and downtrends and defined price reaction zones between buyers and sellers allows traders to make better decisions rather than relying on guesswork. Every trader who practices can obtain this skill because its value makes every effort worthwhile.
You know what’s fascinating? Moving Averages act together with RSI and MACD to provide traders with guidance about market momentum while displaying existing strength and detectable inversion possibilities. Fibonacci retracement? The market holds secret price areas which offer potential bouncing opportunities for traders to identify. The tools provide traders with improved methods to determine when to make their trading moves.
Trading effectively requires the same commitment as driving without vision. When it comes to crypto trading one should seek basic understanding of charts combined with indicators as proper strategy building blocks but both pathways demand committed effort.
Discuss key tools such as trend analysis, support and resistance levels, and chart patterns, with examples relevant to the Steem/USDT market.
Surviving in crypto markets requires proper tools before entering trades. Navigating without a proper compass while sailing is equivalent to trading without necessary tools. Trading on the Steem/USDT market which features enormous price volatility can be clarified by using technical analysis methods. Several essential equipment exists to help people in their decision-making process.
First, trend analysis. The market consistently moves forward at differing speeds which could be either upward or downward as well as static. It is essential to detect market trends at their earliest points. Targeted panic buys prove advantageous when Steem maintains a constant stream of rising peak points and peak points coupled with rising low points because it indicates an upward market trend. On the flip side, a series of lower highs and lower lows? The market situation indicates a downward pattern which suggests waiting may be better than entering at this point.
The next category consists of support and resistance levels. The market demonstrates robust purchasing power when Steem maintains its contact with particular price points which represents support. Sellers use resistance to set an upper limit which keeps the price from rising. When Steem fails to rise above $0.25 repeatedly the market is showing resistance. When Steem manages to break through that threshold it could signal a substantial movement in price upward.
The signaling mechanism used by the market to communicate its intents is through chart patterns. You might observe a double bottom pattern in the Steem/USDT price chart. The strategic rise in price is expected when such a situation emerges. A head and shoulders pattern? The pattern may indicate a price decrease that is going to happen soon. Chart patterns provide trading indicators about upcoming large price fluctuations although they do not provide flawless predictions.
The main value of technical analysis lies in creating advantageous opportunities instead of attempting future market predictions. The speed of change in Steem/USDT markets requires traders to have these analysis instruments in their toolkit. That’s a game-changer.
Question 2: Applying Indicators for Decision-Making |
|---|
Trading in the Steem/USDT market demands steering a vessel in seas with unpredictable waves. Trading performance becomes clearer for many users who adopt the Relative Strength Index (RSI) to determine overbought or oversold conditions in their assets.
Understanding RSI
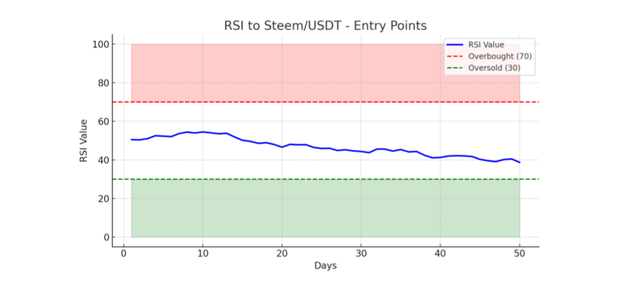
The RSI serves as an oscillator between 0 and 100 which determines speed along with the pace of price changes. Steem exhibits signs of potential price downfall when its RSI exceeds 70 while investors should consider purchasing it when RSI falls below 30.
Applying RSI to Steem/USDT
You have to examine Steem price fluctuations during the past month for your analysis. The indicators show that the RSI surpassed 70 during multiple periods before price downturns took place. The price usually rebounded during times when the RSI value fell below 30.
Making Trading Decisions
By observing these RSI patterns, you might decide to sell some of your Steem holdings when the RSI approaches 70, anticipating a price drop. Alternatively, when the RSI nears 30, it could be an opportunity to buy, expecting the price to rise.
The RSI gives important information but needs to be combined with other elements in addition to deep market research when making trading choices.
Provide a practical example with entry and exit points.
I will discuss RSI as one of the most popular indicators used by traders for their trading operations.
The momentum indicator named RSI serves as a popular tool which assists traders in determining market conditions for overbought or oversold assets. This indicator spreads from 0 to 100 and signals overbought conditions when it exceeds 70 points while undersold conditions appear when it falls below 30 points.
The movement of Steem/USDT RSI above level 70 indicates a potential price decline will occur but when it falls below 30 then it shows the start of a price recovery. RSI functions effectively as an indicator yet production of better trading choices requires its combination with additional performance metrics.
 RSI Indicator in general RSI Indicator in general |
|---|
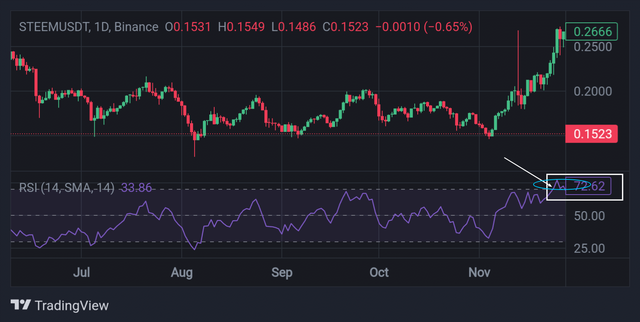
The RSI indicator on TradingView reveals decisive market signals during Steem/USDT price fluctuations by studying historical data. The RSI (Relative Strength Index) serves as an oscillator through momentum analysis to detect price movement speed and direction for identifying market conditions of overbought or oversold states.
 |
|---|
Identifying Overbought Conditions (Exit Signal)
The strong market rally within November drove Steem/USDT prices upward from $0.15 to $0.2666. The overbought sign emerged with the RSI value exceeding 70 reaching 72.62. A warning appeared through the price indicator since the bullish momentum required correction.
 |
|---|
After reaching its peak price the market oriented downward thus turning into a favorable moment for traders who had purchased Steem at lower levels.
To prevent market declines traders should execute trades after overbought points because it enables them to profit from bullish price movements.
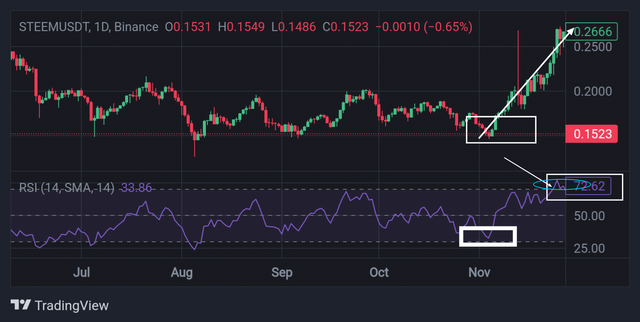
Spotting Oversold Conditions (Entry Signal)
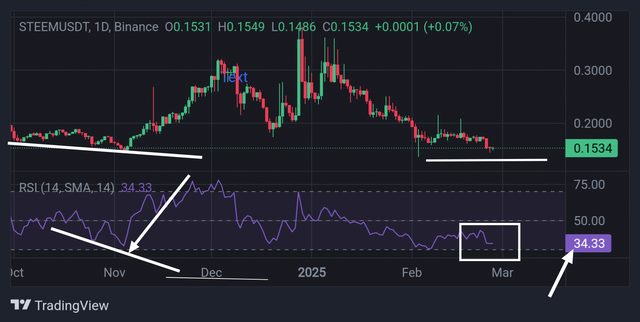
The Steem/USDT market has maintained a descending trend through its steady price deterioration from its original value at $0.20 to its current position at $0.1534. The RSI indicator fell almost to 30 as it registered 34.33 during this time period.
 |
|---|
Even though it failed to undercut the extreme oversold region, the near-30 reading indicated the market was becoming less susceptible to selling forces. The RSI presents a signal for potential price change through reversal or bounce when it reaches near or below value 30.
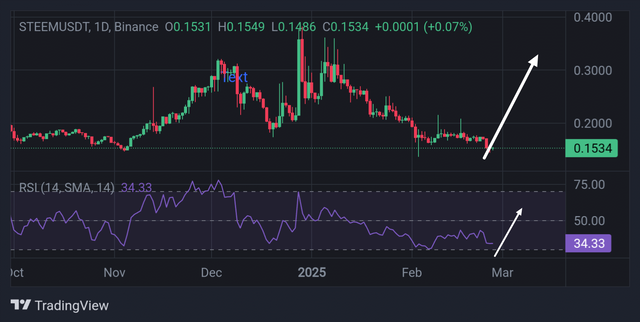
Investors wanting to buy at low risk should think about starting positions in the market because they await brief price rebounds during this phase.
 |
|---|
The RSI value stands at approximately 30 in this chart which shows that Steem/USDT shows indications of becoming oversold. The RSI indicates a right time to purchase when it reaches or falls below 30 because declining selling pressure leads to price reversal potential.
 |
|---|
ADX traders commonly use this value to establish their market entries because they predict upward price movements. Other technical indicators such as support levels and bullish candlestick patterns should be used to validate trade setups.
RSI movement analysis allows traders to detect entry points while minimizing risks because it shows low-risk entry positions. This helps maximize possible profit gains when market recovery happens.
Question 3: Utilizing Chart Patterns |
|---|
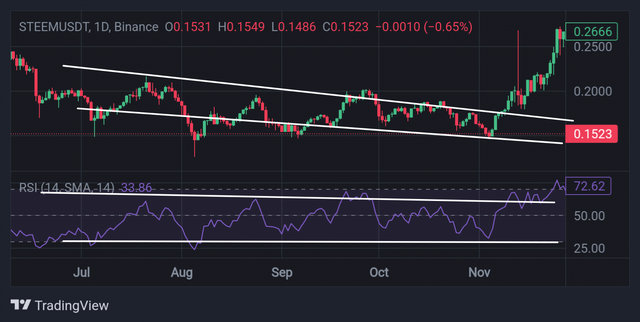
Technical analysis relies on chart patterns as fundamental tools which allow traders to forecast future price movements by studying historical trends. Strategies formed to trade on the market require patterns that include triangles and double tops and head and shoulders formations which often indicate when breakouts occur or when reversals take place.
Triangles: Continuation or Breakout Signals
Before prices break out triangle patterns display three distinct formations including ascending, descending and symmetrical triangles. The combination of higher low points in an ascending triangle shows buying pressure that frequently results in an upward breakout.
When lower highs appear in a descending triangle pattern the formation indicates selling pressure that may lead to a downward breakout. Symmetrical triangles appear when price consolidates that shows traders expect movements in any market direction.
Traders establish their entry orders by the breakout zone while establishing stop-loss levels under support or resistance areas.
Double Tops: Reversal of Uptrend
Uptrend conditions generate bearish reversal patterns in the form of double tops. The price encounters two resistances at equal heights yet fails to surpass these levels which then results in a price decrease upon the breakdown of neckline support.
The break of resistance level prompts traders to sell their positions or start short trades. The neckline must undergo a retest by the price before traders finalize their sell order.
Head and Shoulders: Trend Reversal Indicator
The head and shoulders pattern stands as a very reliable indicator that suggests reversal trends. Crowding occurs when the price action generates three peaks with an elevated central peak (head) between two lower peaks (shoulders) which subsequently breaks through the neckline.
Asset shorting or long position exits become advisable to traders when this breakdown occurs after a bearish trend reversal happens.
The inverse head and shoulders creates bullish signals for price reversal during downward trends as traders receive buy indications after the neckline breaks.
Trading Strategies Based on Patterns
The patterns enable traders to make better decisions about when to enter their trades. Reversal traders track market trends through double tops or head and shoulders patterns to establish entries before breakout traders activate their positions from triangle breakouts.
Safety depends on placing stop-loss orders at positions beneath breakout levels during bullish positions as well as above resistance levels in bearish positions.
By integrating RSI, MACD and Moving Averages trading patterns become more accurate which results in a complete trading formula.
Use a chart to illustrate how these patterns help identify market trends.
The BTC/USDT pair take my attention throughout various time periods when I studied important patterns that affect trading strategies.
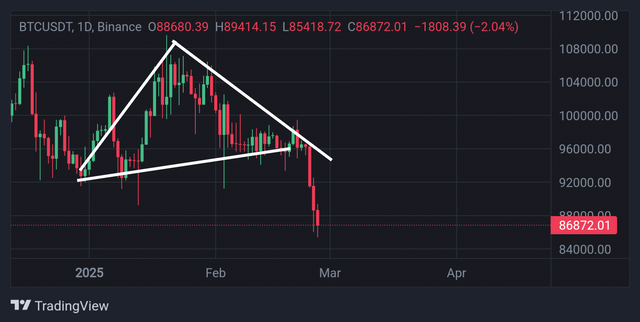 Simple triangle patteren Simple triangle patteren |
|---|
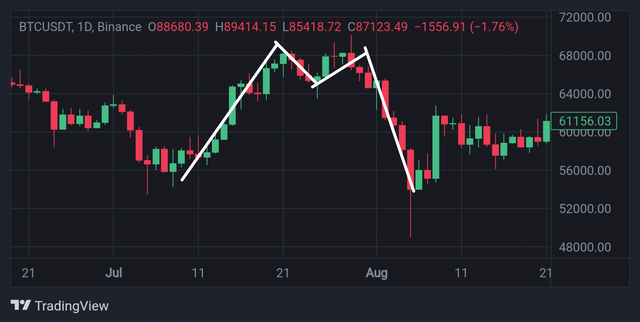 Double tops Double tops |
|---|
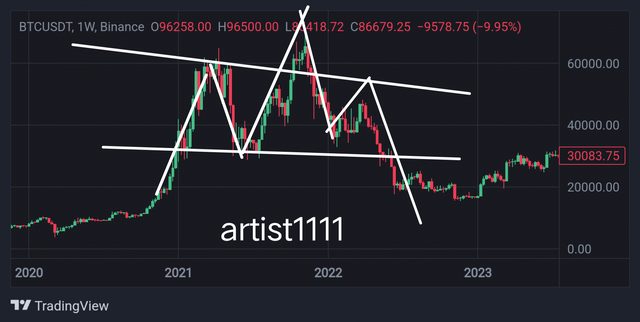 Head and shoulder Head and shoulder |
|---|
I documented triangle formations because these designs signal market breakout opportunities along with double tops that signal bearish market reversals. Also the distinctive pattern of a head and shoulders indicated a powerful change from bullish to bearish market movements.
The identified patterns emerged throughout different market hours to show entry and exit points. Traders who analyze formations together with essential support and resistance points achieve better trading strategies and perform well-timed trades with appropriate risk controls within unpredictable market conditions.
Question 4: Developing a Technical Strategy |
|---|
Creating a trading system for Steem/USDT requires multiple technical analysis tools that help achieve better results and reduce investment risks. A trading strategy built through combining RSI with Moving Averages and MACD leads to better entry and exit points which reduces false signals.
The RSI indicator with a 14-period setting detects when prices become either overbought or oversold. A reading near 30 on the RSI indicates a possible buying signal whereas readings above 70 indicate the asset has become too expensive for selling. The confirmation of trends depends on the use of Exponential Moving Averages at 50-day and 200-day periods. The 50-day EMA crossing above the 200-day EMA produces a bullish crossover that signals an uptrending market and serves as a strong buy signal. A crossover pattern that is bearish indicates that selling pressure is active in the market.
Signals from the MACD (12, 26, 9) system become more robust because it detects shifts in momentum. The market indicates an upward momentum through a bullish MACD crossover where the MACD line crosses above the signal line. However, a bearish crossover signals market reversal. Investors should buy the asset when RSI reaches 30 while maintaining a price position above the 50-day EMA with MACD showing positive crossover indicators. When managing risk through stop-losses traders should place them below recent support levels and they can protect profits by locking them when the RSI reaches 70 or resistance points are tested.
Explain how your approach adapts to different market conditions, such as breakouts, consolidations, or reversals.
A successful Steem/USDT trading approach needs to adjust its strategy across three market situations—breakouts, consolidations, and reversals—through the combination of multiple technical indicators which provide confirmation and risk protection.
During breakout periods price rapidly exceeds significant support or resistance levels. The trend's strength gets verified through the combined assessment of RSI and Moving Averages. A bullish breakout emerges when RSI stays above 50 while the 50-day EMA crosses above the 200-day EMA. The move becomes an optimal trade entry point for long positions when volume indicators show spikes while stop-loss orders should remain beneath the breakout level.
Trading RSI independently during consolidation phases may produce false signals because price tends to stay within a restricted zone. Bollinger Bands serve as a better tool than other indicators for detecting potential breakouts. A breakout above the upper band coupled with increasing volume indicates an upcoming uptrend but a descending volume below the lower band indicates impending market downtrends. Traders should employ range-bound techniques during consolidation periods because the market lacks a clear direction so they should buy at support levels and sell at resistance areas.
In reversal situations MACD functions as a vital tool. When MACD crosses up near significant support levels traders should consider entering a buy position. When the MACD crosses in a bearish fashion near resistance levels it indicates traders should consider selling. Risk control improves through stop-loss modifications which consider volatility levels.
Question 5: Lessons from Real-Life Scenarios |
|---|
The 2021 cryptocurrency market cycle provided a perfect demonstration of how technical analysis shaped trading results because traders obtained either impressive profits or substantial losses through their market signal interpretation abilities.
During its early 2021 strong uptrend period a trader paid close attention to the Ethereum (ETH/USDT) market. In January 2021 the trader detected a bullish breakout after ETH surpassed both its 50-day and 200-day EMA. The bullish momentum of the golden cross combined with an RSI reading between 55-60 affirmed that prices had more upward potential. The price indicator MACD made a crossover within the bullish zone which indicated rising momentum. The trader initiated a long position at $1,400 while implementing trailing stop-losses which allowed profit protection as Ethereum's price exceeded $4,000 in May 2021.
An additional trader made a mistake by choosing to overlook essential reversal indicators. The RSI indicator reached above 80 during mid-May 2021 which showed price was overbought while MACD started displaying bearish divergence with rising prices yet weakening MACD values. The traders maintained their position expecting additional gains despite having secured their profits. The traders suffered substantial financial losses because ETH dropped to $1,700 during June.
The key takeaway? The correct trading approach requires disciplined use of multiple indicators which helps traders identify overbought/oversold signals and protects their positions with stop-losses for successful trading. Traders must monitor both trend changes and technical signals to execute their trades because emotional decisions should never interfere with objective indicators.
kind Regards
@artist1111

Adieu, folks!
May the winds of fortune
carry you to greatness!
May the winds of fortune
carry you to greatness!