Take a look at BTC yearly candlestick charts. What's something in common?
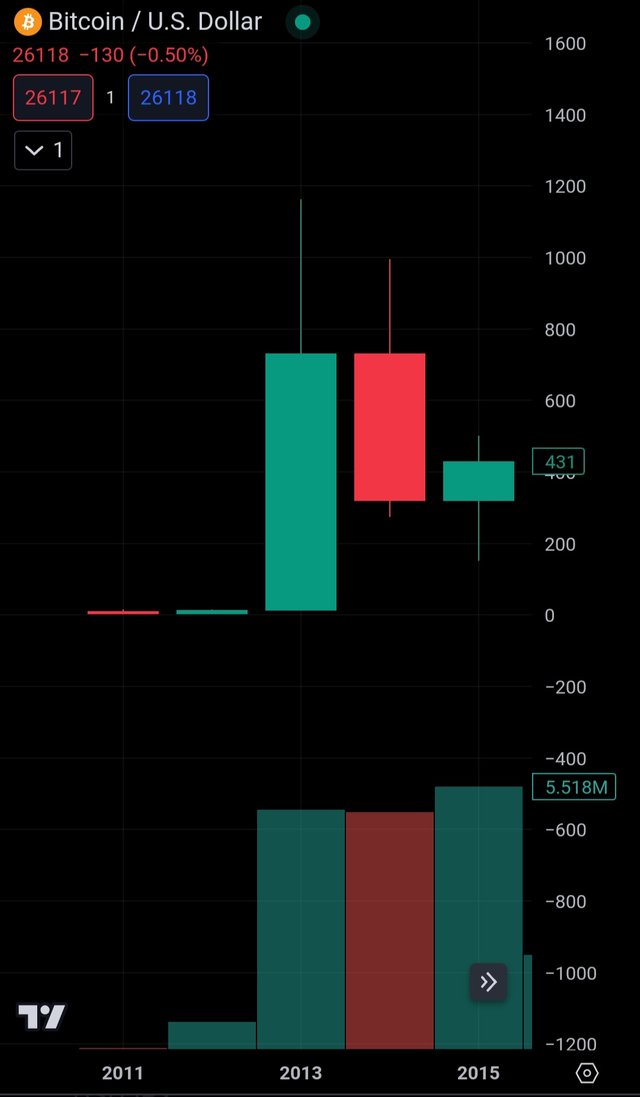
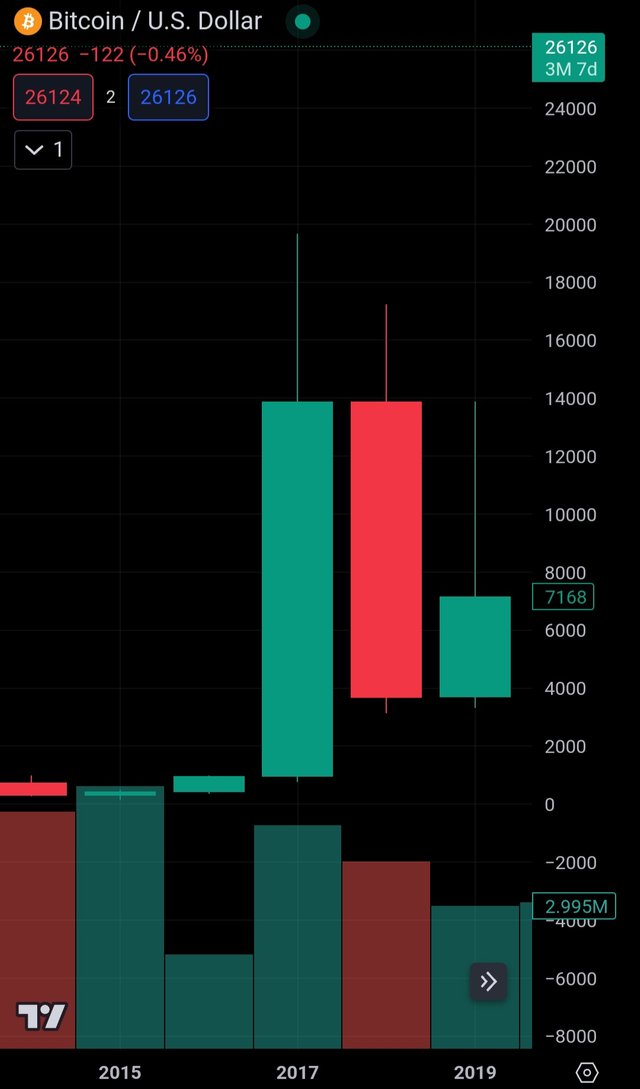
I found something interesting. In the previous bearish markets, next yearly green candles after yearly red candles didn't reach the highest price of the red candles.

Take a look at this cycle chart. Last year was the most terrible year for crypto investors. The color of the candle is red. This year color is green. So, if it follows this pattern, this year the highest BTC price wouldn't reach $48.2k.
If Q4 this year is luckily a bullish market, In my opinion, the target BTC price is $40~45k.
interesting 🤔
🙏
Upvoted! Thank you for supporting witness @jswit.
Your post has been rewarded by the Seven Team.
Support partner witnesses
We are the hope!
@happycapital please teach me work 😁
Gerat post
Wow great post